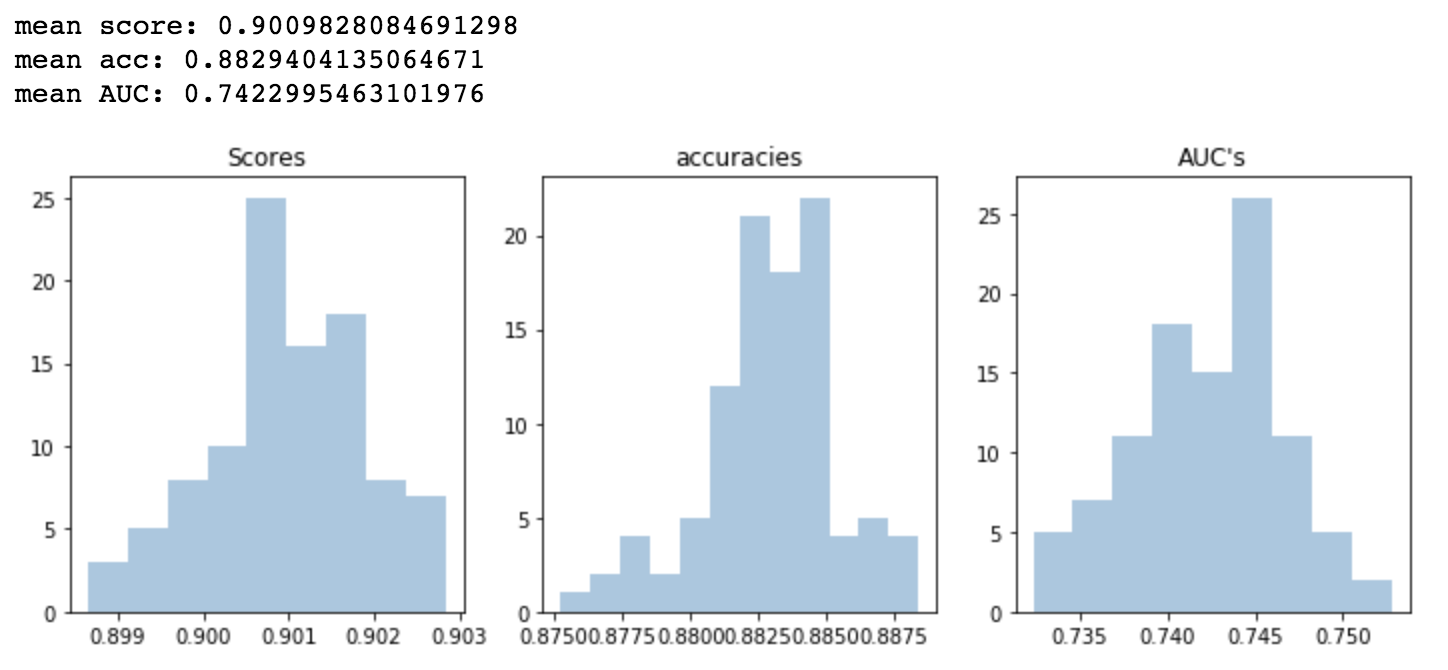
I'm currently testing some models on a simple binary classification task, however, I've found a strange discrepancy between two accuracy score metrics from SK Learn: sk_learn.metrics.accuracy_score and the .score() method on the LogisticRegression class.
They are both supposed to be measuring "accuracy", but after juxtaposing the two, I can't find any obvious differences between them. Can someone help me explain why I'm getting different results for the two methods? And maybe provide a recommendation on which to use? Below is the function I called to run 100 trials of the model with randomized samples from my data set.
I'm also sharing screen shots of the resulting distributions of scores.
def lr_runner(data, ratio, kpi, dropper, d_var, sensitivity=.01):
scores =[]
accs =[]
AUCs = []
tprs = []
mean_fpr = np.linspace(0, 1, 100)
for i in tqdm_notebook(range(100)):
    train, test = randomizer(data, .66, kpi, sensitivity=sensitivity)
    train = pd.get_dummies(train, columns=['categorical_variable1', 'categorical_variable2'])
    test = pd.get_dummies(test, columns=['categorical_variable1', 'categorical_variable2'])
    X_train = train.drop(dropper, axis=1)
    X_train = sm.add_constant(X_train)
    X_test = test.drop(dropper, axis=1)
    X_test = sm.add_constant(X_test)
    y_train = train[d_var]
    y_test = test[d_var]
    results = LogisticRegression().fit(X_train, y_train)
    scores.append(results.score(X_train, y_train))
    accs.append(accuracy_score(y_test, results.predict(X_test)))
    probas_ = results.predict_proba(X_test)
    fpr, tpr, thresholds = roc_curve(y_test, probas_[:, 1])
    tprs.append(interp(mean_fpr, fpr, tpr))
    tprs[-1][0] = 0.0
    roc_auc = auc(fpr, tpr)
    AUCs.append(roc_auc)
print("mean score: {}\nmean acc: {}\nmean AUC: {}".format(np.mean(scores),
                                                           np.mean(accs),
                                                           np.mean(AUCs)))
fig, subplots = plt.subplots(1,3, figsize=(12, 4))
sns.distplot(scores, kde=False, ax=subplots[0])
subplots[0].set_title("Scores")
sns.distplot(accs, kde=False, ax=subplots[1])
subplots[1].set_title("accuracies")
sns.distplot(AUCs, kde=False, ax=subplots[2])
subplots[2].set_title("AUC's")
plt.show()
fig.show()
return scores, accs, AUCs, results

