3
$\begingroup$

got this question to do but I'm totally stuck. It goes as follows :

People call car breakdown service at an average rate of 20 per HR. A Poisson distribution may be assumed to model this situation. 1) by using a suitable approximation find the probability that exactly 250 people call in 12 hrs.

So I know that it follows a Poisson distribution with mean of 240. Ideally I think this is a normal approximation to the Poisson s distribution since mean>15 however the question asks for exactly 250 and as far as I know normal can't do exactly values. Also I don't see how to get a binomial from this since we don't have a value of n

$\endgroup$
1
  • 3
    $\begingroup$ Hint: $250$ corresponds to the entire interval from $250-1/2$ to $250+1/2.$ $\endgroup$
    – whuber
    Commented Jul 7, 2018 at 2:09

1 Answer 1

4
$\begingroup$

Exact Poisson: First adjust the rate to 240 to match 12 hrs. Then let $X$ be the number of calls in 12 hrs, where $X \sim \mathsf{Pois}(240)$ and you seek $P(X = 250) = 0.0205.$ (Computation in R, but computation using the Poisson PDF, or PMF, isn't difficult on a calculator.)

dpois(250, 240)
[1] 0.02053754

Normal approximation: You have $\mu = E(X) = 240$ and $\sigma^2 = Var(X) = 240.$ So $\sigma = \sqrt{240} = 15.4919.$ So $$P(X = 240) \approx P(249.5 < Y < 250.5),$$ where $Y \sim \mathsf{Norm}(\mu = 240, \sigma=15.4919).$ Below is the computation of this normal approximation using R. I suppose you are expected to get the answer by standardizing and using normal tables. See how close you can get. [It may not be exact because a little rounding may be necessary to use printed normal tables.]

diff(pnorm(c(249.5, 250.5), 240, 15.4919))
[1] 0.02090658

Binomial approximation. Don't give up on using a binomial distribution. When $n$ is very large and $p$ is small, $\mathsf{Binom}(n, p)$ is well approximated by $\mathsf{Pois}(\lambda = np).$ Let's try $n = 2400$ and $p = 1/10.$

dbinom(250, 2400, 1/10)
[1] 0.02120139

Or, maybe better, $n = 24,000$ and $p = 1/100.$

dbinom(250, 24000, 1/100)
[1] 0.02060194

Binomial probabilities can be a little messy to compute on a calculator because the factorials in the binomial coefficient are so large.

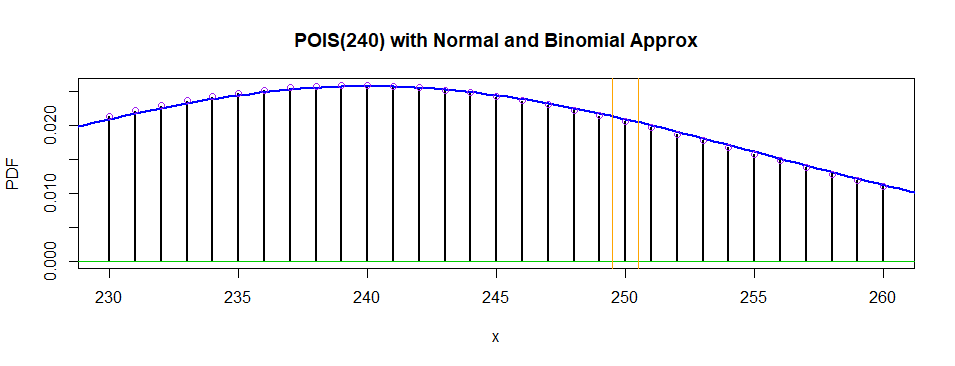
The plot below shows the Poisson distribution (black bars, values between 230 and 260), the approximating normal density curve (blue), and the second binomial approximation (purple circles).
enter image description here

Note: In any case, it is useful to know relationships among binomial, Poisson, and normal distributions.

$\endgroup$
3
  • 3
    $\begingroup$ (+1) But please read the guidance for answering questions tagged "self-study" - we give hints to get people past where they're stuck rather than fully worked-out solutions. $\endgroup$
    – Scortchi
    Commented Jul 7, 2018 at 8:40
  • 1
    $\begingroup$ Thanks guys(especially Bruce). One thing tho how did you arrive at those binomial values for n and p ? $\endgroup$
    – user122343
    Commented Jul 7, 2018 at 10:39
  • 1
    $\begingroup$ Lots of latitude on that: Something very big for $n$ and choose $p$ so that $np = \lambda.$ // Make sure you understand how to use normal tables to get the normal approximation. I think that was the main point of your assignment. The rest is just so you'll see the larger picture. $\endgroup$
    – BruceET
    Commented Jul 7, 2018 at 16:54

Your Answer

By clicking “Post Your Answer”, you agree to our terms of service and acknowledge you have read our privacy policy.

Not the answer you're looking for? Browse other questions tagged or ask your own question.