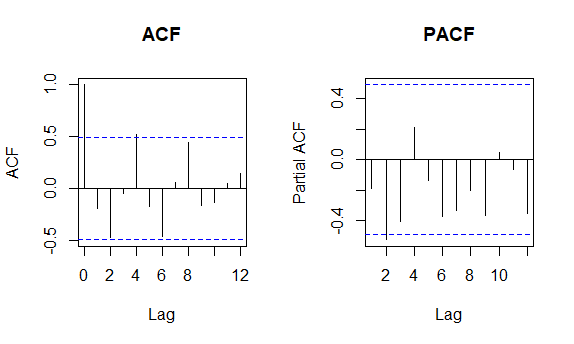
I am performing an interrupted time series analysis. I plotted the data and then checked for autocorrelation using ACF and PACF.

par(mfrow=c(1,2))
acf(residuals(model_ols), main="ACF")
acf(residuals(model_ols), type = "partial", main="PACF")
How do make sense of this plot now? Can someone tell me what should be the next step?
