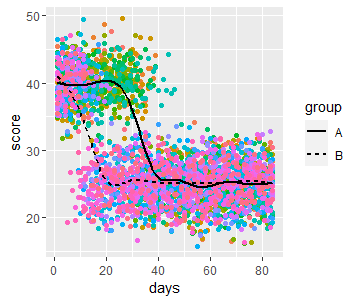
I am trying to create a hierarchical changepoint detection model in JAGS, estimating group difference in changepoint based on individual changepoints in scores for an outcome variable (fictional in this case). I can run a non-hierarchical version of this same analysis, based on a single set of scores, but am having trouble thinking through the hierarchical structure in JAGS.
Here is code for creating the toy data. score is a fictional outcome variable measured on each of 84 days for forty individuals (variable id) divided equally among two groups (variable group). Data is created so the individuals in group A tend to have a later breakpoint (around day 34) than those in group B (around day 15).
set.seed(1234)

breakpointG1 <- NA
for (i in 1:20) { breakpointG1[i] <- round(rnorm(1, 34, 5)) }
breakpointG2 <- NA
for (i in 1:20) { breakpointG2[i] <- round(rnorm(1, 15, 5)) }
bps <- c(breakpointG1, breakpointG2)
group <- rep(c("A", "B"), each = 20)
df <- data.frame(id = NA, days = NA, group = NA, score = NA)
for ( i in 1:length(bps) ) {
pre <- rnorm(bps[i], 40, 3) #
post <- rnorm(84-bps[i], 25, 3)
dfi <- data.frame(id = i, days = 1:84, group = rep(group[i], 84), score = c(pre, post))
df <- rbind(df, dfi)
}
df <- df[-1,]
Now plot all participants in one graph, but with a separate loess-smoothed line for each group.
ggplot(df, aes(x = days, y = score)) +
       geom_point(aes(colour = factor(id))) +
       geom_smooth(aes(group = group, linetype = group), colour = "black", span = 0.5, se = F) + guides(colour = F)
The difference in group change thresholds is clearly visible on this graph. Now for the Bayesian analysis verifying what we can see with our eyes. First step is to create the data list from the dataframe.
y <- df$score
sdY <- sd(y)
mY <- mean(y)
g <- as.numeric(as.factor(df$group))
sid <- df$id
days <- df$days
nTotal <- nrow(df)
nDays <- max(df$days)
nID <- length(unique(sid))
nG <- length(unique(g))
We also need a vector where each element is the group number of the subject in question (i.e. there will be 40 elements in this vector)
groupOfSubject = NULL
for ( sIdx in 1:nID ) {
  groupOfSubject = c( groupOfSubject , unique(g[sid==sIdx]) )
}

dataList = list(y = y,
                sdY = sdY,
                days = days,
                sid = sid,
                nTotal = nTotal,
                nDays = nDays,
                nID = nID,
                nG = nG,
                groupOfSubject = groupOfSubject)
Now the model string for jags. The main things I am interested in estimating are the group changepoints muChng[] and the muB[]s for pre- and post-breakpoint score. I have used nested indexing but I must confess I am out of my depth here.
cat("
    model{

    # likelihood
    for (oIdx in 1:nTotal) {
    y[oIdx] ~ dnorm(mu[sid[oIdx]], 1/sigma^2)
    mu[sid[oIdx]] <- b1[sid[oIdx]] + step(days[oIdx] - chng[sid[oIdx]])*b2[sid[oIdx]]
    }

    # priors
        # on subject-level id for b
        for (sIdx in 1:nID) {
             b1[sIdx] ~ dnorm( muB1[groupOfSubject[sIdx]], 1/10^2 )
             b2[sIdx] ~ dnorm( muB2[groupOfSubject[sIdx]], 1/10^2 )
             chng[sIdx] ~ dnorm( muChng[groupOfSubject[sIdx]], 1/10^2 )
             }

            # prior on group
            for (gIdx in 1:nG) {
                 muB1[gIdx] ~ dnorm(0, 1e-6)
                 muB2[gIdx] ~ dnorm(0, 1e-6)
                 muChng[gIdx] ~ dunif(1,nDays)
                 }

    # prior on Sigma
    sigma ~ dunif(1/sdY*10,sdY*10)

    }", file = "temp.jag")
Next adapt the mcmc chains using rjags::jags.model().
library(rjags)
jagsModel <- jags.model(file = "temp.jag",
                        data = dataList,
                        n.chains = 3,
                        n.adapt = 1000)
But the model doesn't run
Error in jags.model(file = "temp.jag", data = dataList, n.chains = 3,  :
  RUNTIME ERROR:
Compilation error on line 7.
Attempt to redefine node mu[1]
I am not as familiar with breakpoint models as with the general linear model so am not sure where I am going wrong. Something to do with the nested indexing in the definition of mu[] in the likelihood function I think, but I can't see where, and none of the alternatives I have tried seem to work. Any help much appreciated.

