0
$\begingroup$

So I am struggling with a question in statistics following :

An investment broker reports that the yearly returns on common stocks are approximately normally distributed with a mean of 12,4% and a standard deviation of 20,6%. On the other hand, the firm reports that the yearly returns on tax-free municipal bonds are approximately normally distributed with a mean return of 5,2% and a standard deviation of 8,6% Find the probability that a randomly yearly selected :

c) Common stock will give more than a 10% return.

Formula : $P(0,01>b)=1-P(X\le b)$

$Z=0,10-12,40/20,60 = 0,597$

Which gives me 0,2743 on normal table and :

$1-0,2743 = 0,7257$

So this should in theory mean the probability of more than 10% revenue is 0,7257?

The next question is with a loss of at least 10% how should I compute that?

$\endgroup$
1
  • $\begingroup$ Welcome to CV. This seems like homework. If so, remember to use the [self-study] tag. $\endgroup$ Commented Jul 24, 2018 at 23:52

1 Answer 1

2
$\begingroup$

Using software to check first computation: You have $X \sim \mathsf{Norm}(\mu=12.4, \sigma=20.6).$ You seek $P(X > 10) = 1 - P(X \le 10) = 0.5464.$

Computations are in R statistical software, where pnorm is a normal CDF. Because of rounding involved in the use of normal tables, your answer might be a little different. [It seems you have the right approach, but with a mistake at the start. I will leave it to you to fix the standardization.]

1 - pnorm(10, 12.4, 20.6)
## 0.5463738

For the next part you seek $$P(X < -10) = P\left(\frac{X-\mu}{\sigma} < \frac{-10-12.4}{20.6}\right) = P(Z < -1.087) = \dots \approx 0.1384.$$

pnorm(-10, 12.4, 20.6)
##  0.1384348

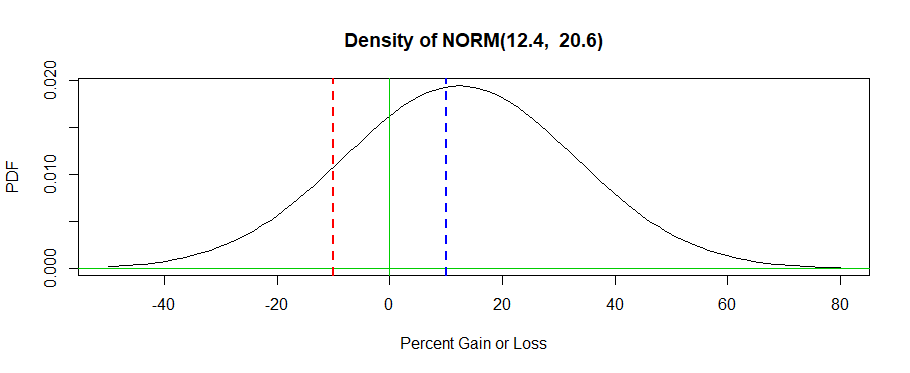
The figure below shows the density function of $\mathsf{Norm}(12.4, 20.6),$ with vertical lines at $\pm 10.$ The first answer is the area under the normal curve to the right of the right-hand vertical line; the second is the area under the curve to the left of the left-hand line.

enter image description here

Note: It is always a good idea to make sketches of normal curves and areas when working problems like these. By hand, you can't make a sketch as accurate as the figure above, but with some practice you can make a sketch that is accurate enough to catch gross computational errors. (For example, there is no way the area to the right of the vertical blue line exceeds 70%.)

$\endgroup$

Your Answer

By clicking “Post Your Answer”, you agree to our terms of service and acknowledge you have read our privacy policy.

Not the answer you're looking for? Browse other questions tagged or ask your own question.