4
$\begingroup$

I have an algorithm which gives an AUC (area under the receiver operating curve) of 0.94.

I mean, this is amazing, but... probably too amazing, considering the difficulty of the task I am working on. So how can I tell if the AUC is valid, or misleadingly high?

(P.S. yes, I am training on the training set and testing on the completely separate testing set.)

$\endgroup$
6
  • 3
    $\begingroup$ There are any number of errors in pipelining/preprocessing that can cause out-of-sample loss to be biased upwards and not reflect true loss. Are your samples correlated in some way (in space, or time, or network, or... )? Did you distinguish between data transformations on the training set and transformations on the test set? Etc. $\endgroup$
    – Sycorax
    Commented Jul 31, 2018 at 15:13
  • $\begingroup$ Right, sorry - I meant to ask, modulo any preprocessing errors. In other words, supposing the performance on the test data is in no way biased by leakage of information, can the AUC score still be misleadingly high as a metric choice? $\endgroup$
    – John Smith
    Commented Jul 31, 2018 at 15:18
  • $\begingroup$ AUC is not a good metric for data with very unbalanced classes. Area under the precision-recall curve might be a better choice. $\endgroup$
    – Dan
    Commented Jul 31, 2018 at 15:21
  • 1
    $\begingroup$ @Dan Can you clarify your meaning? In "An introduction to ROC analysis", Tom Fawcett provides a proof that ROC curves are insensitive to changes in class composition. $\endgroup$
    – Sycorax
    Commented Jul 31, 2018 at 15:28
  • 4
    $\begingroup$ @Dan It seems like you're saying the same thing with different implicit assumptions. I'm saying that a ROC curve is not sensitive to imbalanced classes, and I think that's a good thing. You seem to be saying that you would prefer to use a metric that is sensitive to class imbalance. $\endgroup$
    – Sycorax
    Commented Jul 31, 2018 at 15:38

3 Answers 3

13
$\begingroup$

One possible reason you can get high AUROC with what some might consider a mediocre prediction is if you have imbalanced data (in favor of the "zero" prediction), high recall, and low precision. That is, you're predicting most of the ones at the higher end of your prediction probabilities, but most of the outcomes at the higher end of your prediction probabilities are still zero. This is because the ROC score still gets most of its "lift" at the early part of the plot, i.e., for only a small fraction of the zero-predictions.

For example, if 5% of the test set are "ones" and all of the ones appear in the top 10% of your predictions, then your AUC will be at least 18/19 because, after 18/19 of the zeroes are predicted, already 100% of the ones were predicted. Even if the top 5% are all zeroes.

A simple python example:

import sklearn
import numpy as np

yTest = [0,0,1,1,0,1,0,0,1,0,0,0,0,0,0,0,0,0,0,0,0,0,0,0,0,0,0,0,0,0,0]
yPredicted = np.linspace(0.9, 0.1, num=len(yTest))
sklearn.metrics.roc_auc_score(yTest, yPredicted) # ~0.89

import matplotlib.pyplot as plt
fpr, tpr, threshold = sklearn.metrics.roc_curve(yTest, yPredicted)
plt.plot(fpr, tpr)
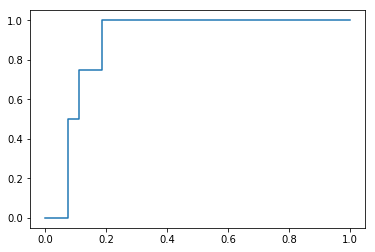
AUC curve from the python code sample

Whether this is a "bad" prediction depends on your priorities. If you think that false negatives are terrible and false positives are tolerable, then this prediction is okay. But if it's the opposite, then this prediction is pretty bad.


A common real world scenario where this happens is when you include samples that are "out-of-scope" in your model, and your model correctly identifies that all those samples have ~0% chance of having target=1.

For example, suppose you are predicting the probability of a transit employee getting into a vehicle collision, and you use, as a predictor, a categorical variable "job type" which has values "bus driver", "ticket booth operator", and "fare enforcer". Your model will identify that the booth operators and fare enforcers have ~0% chance of a crash, putting them all at the tail end of your predictions and increasing the concentrations of 1s at the top, inflating your AUC. However, the business folks who commissioned this model would know that those job types are obviously not candidates, and if you asked them, they would tell you not to include those samples in the scope of your model. Adding the obvious out-of-scope samples artificially inflated your AUC. (This has happened to me multiple times, where my "first pass" of a model gave me an AUC >98% making me think I'm a rockstar, until I trimmed down the scope and then observed a more sobering score.)

$\endgroup$
0
$\begingroup$

Datasets used for predictive modeling rarely have the variability necessary to develop and evaluate a model as widely applicable as others believe it to be. There are encroaching expectations that models be applicable across seasons, years, in different settings, and among different populations. It doesn't matter whether one uses bootstrapping, cross-validation, or split sample validation when the dataset itself is neither independent nor representative of its target application.

Just the other day, I looked at a patent for an ML algorithm that promised to classify cancerous nodes from radiographic imaging of the lungs. But the cancer cases that were sampled came from a largely white, male, older population... and there were no controls (non-cancer screens). The disconnect between development and application is appalling, there's a complete lack of scientific thought.

$\endgroup$
3
  • 1
    $\begingroup$ This is a valuable comment for predictive models in general ("concept drift"). I just fail to see how it specifically addresses the issue of an AUROC potentially being misleadingly high. $\endgroup$ Commented Jul 31, 2018 at 16:25
  • $\begingroup$ @StephanKolassa since the AUC is an empirical summary, it's never wrong as a way of summarizing the data. 94% AUC in the validation sample $\implies$ there's a 94% chance a randomly selected case has higher risk than a control in the validation sample. So the only relevance this question has is when we discuss expecting a 94% U-statistic in another dataset. The "big picture" here that nobody sees is how and why this "other" dataset differs from the microcosm of split sample validation. $\endgroup$
    – AdamO
    Commented Jul 31, 2018 at 16:42
  • $\begingroup$ As I said, your points are completely correct. They are just not specific. They apply equally well to proper scoring rules. And to accuracy, which is also an empirical summary but which I'd say is wrong in the sense of "badly misleading". The question here is whether AUROC is also misleading as is accuracy, or whether AUROC is in principle valid, and we need to keep concept drift in mind as for any model. $\endgroup$ Commented Jul 31, 2018 at 16:49
-1
$\begingroup$

Agree with Dan, it could be that your dataset on has a 6% event rate, so 94% 0 and 6% 1's, so the dataset is imbalanced. The model without weights and with a cut-off value of 0.5, will come back as everything predicted as 0 and so will have ~94% accuracy.

If you try using a suitable cut-off value and then recompute the confusion matrix and other metrics, you should get a more resonable result.

$\endgroup$
2
  • 3
    $\begingroup$ The question asks about ROC AUC, not accuracy so this does not appear to answer the question. $\endgroup$
    – Sycorax
    Commented Jul 31, 2018 at 15:29
  • 2
    $\begingroup$ But OP is talking about AUC, not accuracy... $\endgroup$
    – Dan
    Commented Jul 31, 2018 at 15:30

Your Answer

By clicking “Post Your Answer”, you agree to our terms of service and acknowledge you have read our privacy policy.

Not the answer you're looking for? Browse other questions tagged or ask your own question.