binomial regression
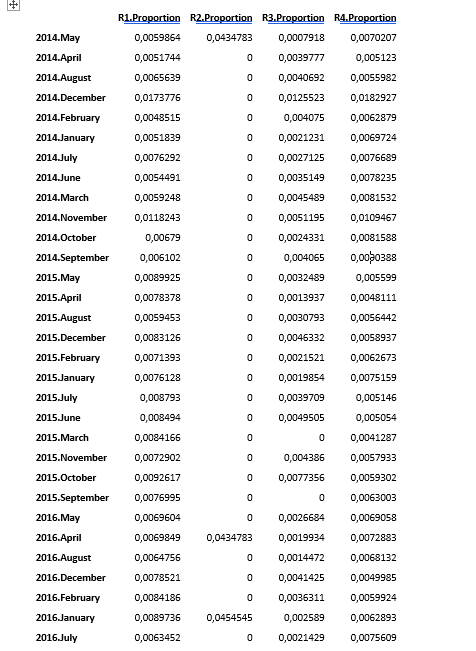
Instead of using the ratio's you can stay more close to your raw numbers.
Basically these are binomial distributed data (the number of deaths per total amount pregnancies) where the probability parameter is to be estimated and compared.
You can do this with a https://en.wikipedia.org/wiki/Binomial_regression which you find in most software environments under GLM (generalized linear model) an extension/variant of ordinary least squares regression.
beta regression
This beta-regression is what you would use when you consider the variability of the probabilities/ratios themselves (not the variability in the sampling of the individuals from the population with a specific probability).
Example: say you wish to know the difference between the difference in school performance between boys and girls. You measure (sample) at several schools performance of several boys and girls in order to estimate the state of the whole population of boys and girls. Then you will have two (nested) sources of error due to random sampling. (1) One is that the sampling of students at a specific school may not include all the students at that school. So your sample will only be an estimate of the true rates of performance at that school. (2) another is that the schools themselves may have variation in their individual school mean performance, and you will make an estimate about the grand mean performance of all schools based on a random variation in your sample.
It is the first variation that is binomial distributed and the second variation that is often (considered) beta distributed (because proportions are between 0 and 1 and the beta distribution corresponds to this).
Especially since you have low numbers (meaning large sample errors in the counting of cases within the groups) I believe that a binomial distribution is the best to model the distributions.
You might possibly consider a beta-binomial distribution (within a GLM framework you can use a quasi-binomial distribution family). although this may not be easily combined with mixed effects (at least in R I am unaware of functions that do this). But then again the changes due to month which you might consider as random effect should possibly not be considered as random, as in Gaussian distributed, but more something that follows a more strict pattern.

