0
$\begingroup$

I am working with a dataset from my job which is the number of "events" that occur at 70 different locations on a daily basis, over 964 days. So I have univariate panel data. I imagined each location likely has their daily events poisson distributed, with some autocorrelation. Each location likely has a different value of lambda due to differences in size, staff, etc, however most days have zeros, and twos are extremely rare. So I figured lambda is low in general (and extremely low for some locations). I decided to check if there was overdispersion before I figured out how to remove the autocorrelation from my dataset (if anyone has any suggestions for how to do that, that would be great).

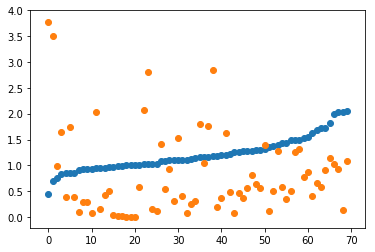
I got a really bizarre and unexpected result I have not been able to understand. So what I did is I graphed the means (orange below) for the 70 locations (each tick on the x axis is a different location), and the variance/mean (blue). As you can see, all 70 locations are exclusively underdispersed. What is super puzzling, is for every location, the mean + the variance/mean is nearly exactly one! If you add the mean and the mean + variance/mean for every location, the minimum of the 70 is 1.0004676334594305 and the max is 1.0010245901639392. In addition, the function of mean/variance relative to mean is perfectly monotone below.

Daily Time Series Data for 70 locations (Orange = Mean, Blue = Variance/Mean)

How can this happen?

If I run the exact code resampling by week (sum of events each week), I get the second graph, which is more of what I was expecting from the daily data. In my second graph, the median of variance/mean is 1.15, and the mean of variance/mean is 1.21 across all the locations. Is that overdispersed? Is there a formal test I could do? Should I treat only a subset of the locations as overdispersed? I had someone suggest zero-inflated poisson regression, however I'm skeptical that is the best option.

I'd prefer to do my analysis with the daily data, but I'm not sure if that is a good decision. Given my goals here (detecting and removing autocorrelation from my dataset, preferably with the daily data), what approach should I take here? But I'm also extremely interested in the relationship in my first graph and how such a thing could be explained/happen.

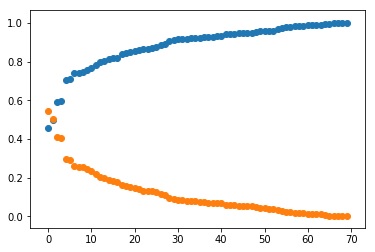
Resample by Week (Orange = Mean, Blue = Variance/Mean)

$\endgroup$
8
  • $\begingroup$ Interesting. Just to check: your blue curve is mean/variance, not the inverse, right? Because if it was variance/mean, I could have an hypothesis. $\endgroup$
    – Roland
    Commented Sep 26, 2018 at 19:17
  • $\begingroup$ Wow I'm dumb, it is in fact variance/mean. I mistyped it backwards in every instance in my post. Yes, my original idea was to test if there was overdispersion, and >1 indicates overdispersion (variance greater than mean) $\endgroup$
    – zzzzz94
    Commented Sep 26, 2018 at 20:07
  • 2
    $\begingroup$ Cool! Then I guess that the first graph is consistent with the idea that there are few instances of 2s and 3s. If the rv is distributed as a Bernoulli, then variance is mean times (1-mean). Which means that "mean + variance/mean" will be close to one. $\endgroup$
    – Roland
    Commented Sep 26, 2018 at 20:20
  • $\begingroup$ For your modelling purposes, one possibility would be to consider that your daily outcome is actually a binary variable (event or nothing). From what you show in the first graph, it might be a better fit than the Poisson model. Binary models are also convenient to look at autocorrelation and do prediction, if this is your purpose. $\endgroup$
    – Roland
    Commented Sep 26, 2018 at 20:55
  • $\begingroup$ Still doesn't make much sense, because although each day is bernoulli distributed, the total for each location is binomial distributed with n = 964, no? You do not get the mean + variance/mean = 1 with the binomial distribution $\endgroup$
    – zzzzz94
    Commented Sep 27, 2018 at 13:56

1 Answer 1

0
$\begingroup$

(This answer is to gather elements from our conversation in the comments, to clear things up). Let's denote $Y_{it}$ the number of events occurring during day $t$ in location $i$.

Your top figure is consistent with the fact that $Y_{it}$ contains few elements other than 0 and 1. Suppose that $Y_{it}$ is distributed iid as a $Bernoulli(p_i)$. In this case, you will have $E(Y_{it}) = p_i$, $Var(Y_{it}) = p_i(1-p_i)$, so that $E(Y_{it}) + Var(Y_{it})/E(Y_{it}) = p_i + p_i(1-p_i)/p_i = 1$. This is consistent with what you note in the top figure. Note that summing up a sufficiently large number of Bernoulli, when $p_i$ is small leads to a Poisson process.

Your last question is about how to model such a process, in order to detect autocorrelation. Considering each $Y_{i.}$ as a time-series taking binary values, you could start by using a Markov chain, which is the simplest manner to model persistence in a categorical variable. A Markov process assumes that $Y_{it}$ only depends on $Y_{i,t-1}$. To see how it fits your data, you can test whether the Markov assumption holds in your data (using e.g. this paper). If it does not, you could try processes that are more complex (where $Y_{it}$ may depends on $Y_{i,t-1}$, $Y_{i,t-2}$...).

$\endgroup$

Your Answer

By clicking “Post Your Answer”, you agree to our terms of service and acknowledge you have read our privacy policy.

Not the answer you're looking for? Browse other questions tagged or ask your own question.