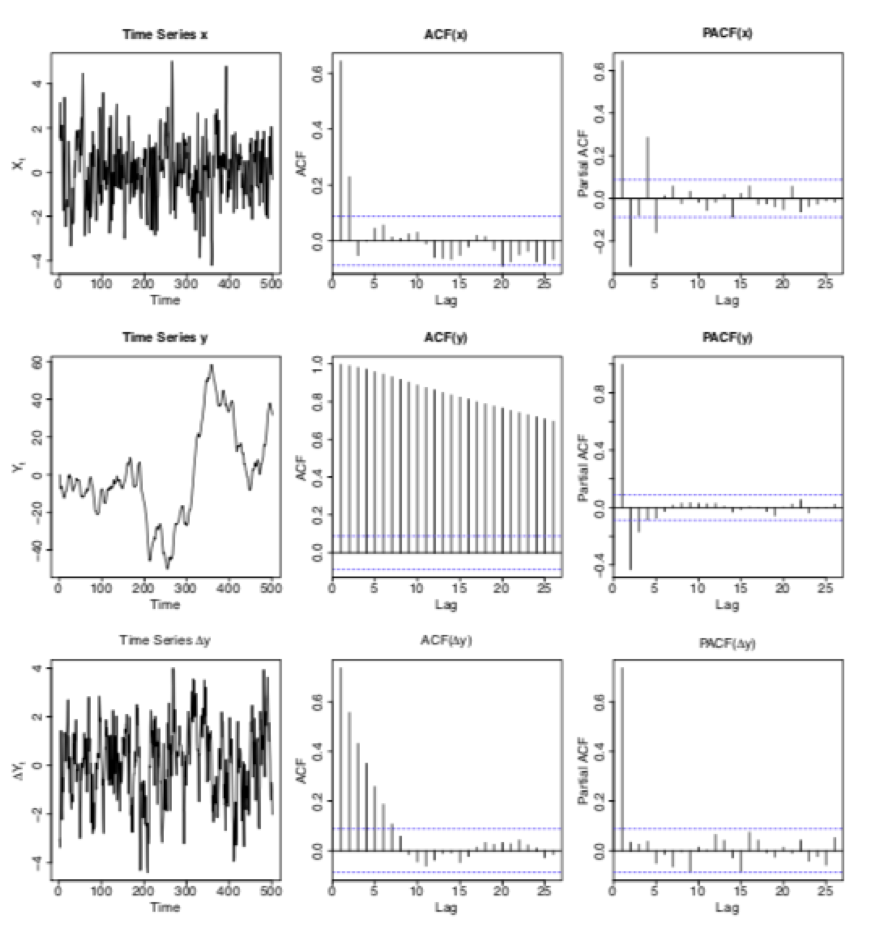
I have the following graphs and I need the X_{t} and Y_{t} graphs and ARIMA(p,q,d) models to which the graphs correspond? Does anybody know the graphs or does anybody know how to do this?
-
1$\begingroup$ Is this homework? $\endgroup$– jbowmanCommented Oct 15, 2018 at 16:56
1 Answer
Series Y is visually non-stationary . Two useful remedies for non-stationarity are to either difference the data or to incorporate level shift indicators i.e. to demean . In my opinion ( without having the actual data ) I would suggest the latter where you have two level shifts thus three local means AND an ar structure as there seems to be some persistance rather than a flip-flop in the values around the local mean. In conclusion you would have two deterministic input series and an arima component of (1,0,0) thus a hybrid model.
Series x looks like it might have an AR(2) as the acf dominates the pacf and possibly a higher order component.Perhaps (2,0,0) plus ....
Only the data knows for sure ... If you wish to post the actual data I may be able to help further.
