1
$\begingroup$

I want to do Kolmogorov -Smirnov test to see whether my data follows a particular distribution or not? When I fitted my data to lognormal distribution it fitted well. But When I am doing ks test, it is rejecting the null hypothesis. Also, my sample size is very large like 1047304 samples. So I took 1000 samples where I thought both empirical and observed data are mostly correlated. The thing is

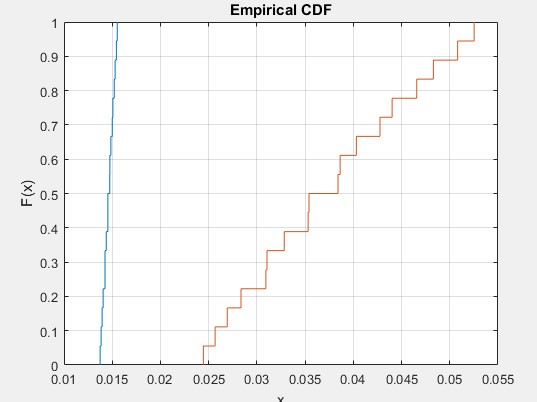
1) I haven't studied any statistics. In wiki, they gave that the Kolmogorov–Smirnov statistic quantifies a distance between the empirical distribution function of the sample and the cumulative distribution function of the reference distribution. As far as I understood, for each x value, we measure corresponding F(x) or cumulative probability values and these values vary according to the type of distribution we choose. We measure the distance between F(X) values of theoretical distribution and the reference distribution. Am I right?

2) I have used following code in Matlab for kstest

cdf2=logncdf(area1out,-3.60186,0.347719);
cdfplot(area1out)
hold on;
cdfplot(cdf2)
[h,p,ksstat2]=kstest2(area1out,cdf2);

'area1out' is my data. The values -3.60186 and 0.347719 are the parameters estimated after fitting the data to the lognormal distribution. The result is h=1, p=0, and ksstat=0.9297

3) I got the output as follows
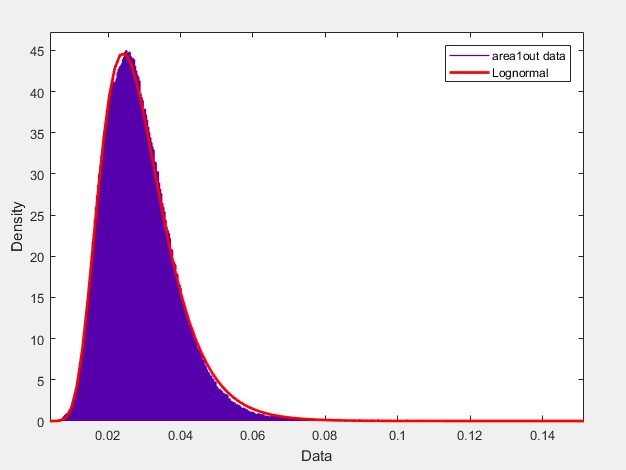
This figure shows the good fit of the lognormal distribution

enter image description here

The second picture is showing the difference between both CDFs I guess. enter image description here
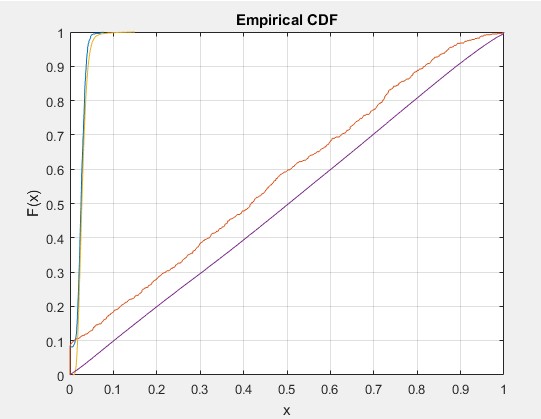
When I took 1000 samples the output is like this.

I am feeling like I am thinking wrong and making a big blunder. please help me to understand ks test practically. I will read the whole theory behind it but help me to understand this in a simple way as I am very new to this and had to work on this problem.

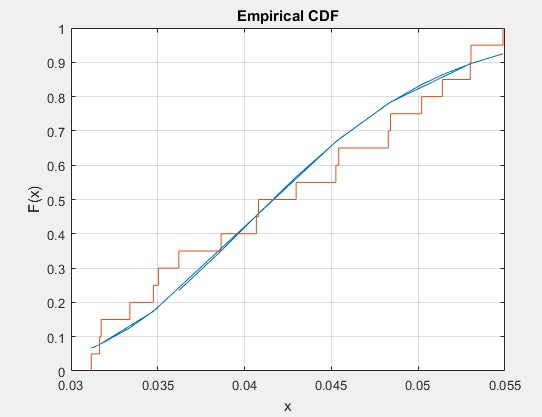
EDIT: No matter how many different combinations of samples and (with small sample size) I have taken, the distance is very large. When I zoomed my data it is like this and the corresponding test results are in 2nd figure. enter image description here enter image description here
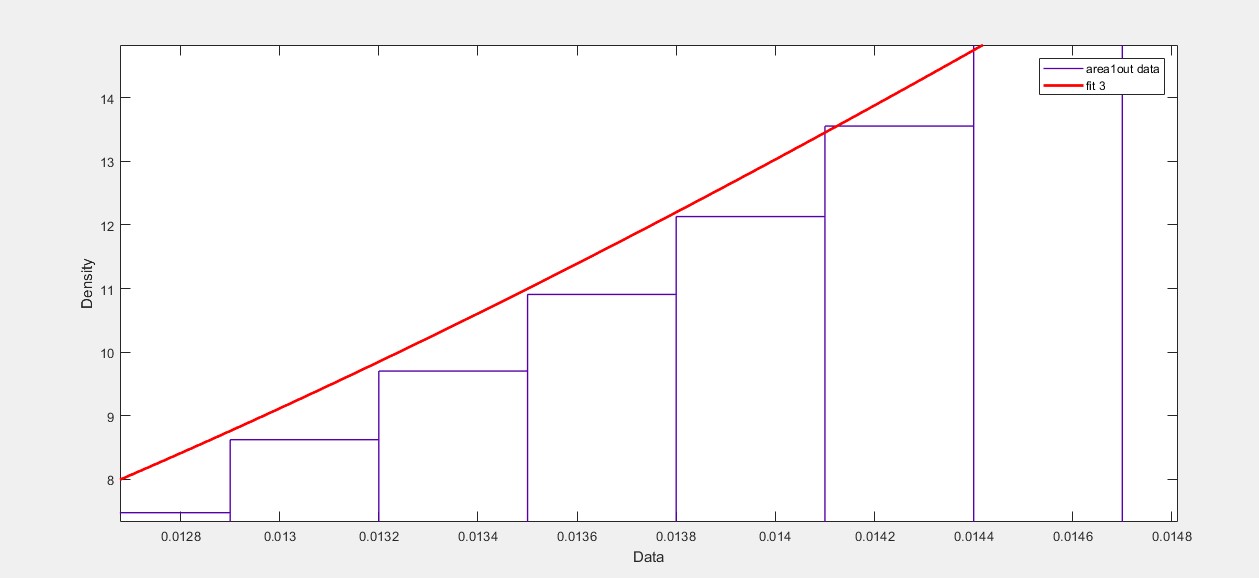
Is there a problem with the parameter values I have taken to estimate the CDF? Or my data really not fitted lognormal distribution?

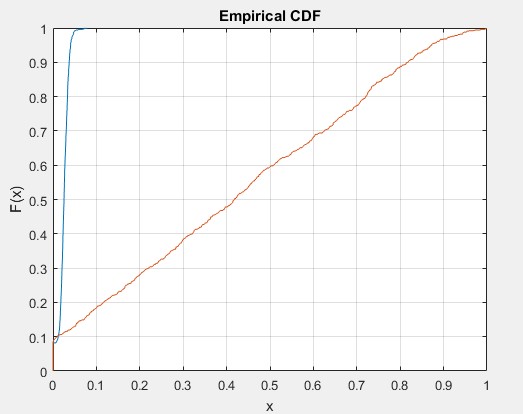
$\endgroup$
5
  • $\begingroup$ what other distributions have you tested against? The figures agree with the results - there is a difference between the data and a lognormal (1000 samples still is enough to detect subtle differences). Do you have a strong theoretical reason for choosing log normal? It is clear you actual data is not exactly a lognormal, but a lognormal data generating process may explain a high proportion of the data, but perhaps there is another process that causes the deviations from lognormal? Or maybe the data sampling is creating a skew in the data that perturbs the distribution? $\endgroup$
    – ReneBt
    Commented Dec 4, 2018 at 15:07
  • $\begingroup$ From the Wikipedia page on the K-S test: "If either the form or the parameters of F(x) are determined from the data $X_i$ the critical values determined in this way are invalid." So the statistical test you are trying to apply isn't strictly correct. Looks like you have an excess of values at or near 0, versus a strict log-normal. $\endgroup$
    – EdM
    Commented Dec 4, 2018 at 18:21
  • $\begingroup$ @ReneBt I have tested for other distributions like normal, Weibull, log-logistic. I want to model my data to show that it follows a certain distribution. It is a radar data from a homogeneous region. I want to justify that it follows the lognormal distribution in general. This time I would like to try with other 100 samples. $\endgroup$
    – veda Lu
    Commented Dec 5, 2018 at 9:01
  • $\begingroup$ @EdM Parameters of F(X) means are they parameters mu and sigma of lognormal distribution? If they are not from the data what should I take? Sorry I did not understand completely. Can you elobrate excess of values near zero means? I have excess zeros near tail but I ignored them. $\endgroup$
    – veda Lu
    Commented Dec 5, 2018 at 9:25
  • 1
    $\begingroup$ First, the K-S test is OK for comparing data against a pre-specified theoretical distribution, but p-values are not correct if you derive the parameters ($\mu$,$\sigma$) of the theoretical distribution from the data, as you did. Second, it looks like about 10% of your data points have a value of 0. That wouldn't be the case if your data truly had a log-normal distribution. Ignoring the 0 values is not wise. What you have might be a 0-inflated log-normal distribution. @Tim is correct: K-S tests are of limited value; with large data sets they tend to give "significant" yet minor differences. $\endgroup$
    – EdM
    Commented Dec 5, 2018 at 15:26

2 Answers 2

3
$\begingroup$

I would always advise against using any statistical test that tries to quantify whether two distributions are similar, such as the Kolmogorov-Smirnov Test. Because it evaluates whether the difference from a sample distribution and an empirical one is significantly different from 0, it does not have enough power in small sample sizes; thus even if the distribution is not from the empirical one the test would not be significant.

If the sample size is too large, such as in your case, KS will almost always be significant, even for a slight deviation from the empirical distribution.

Here is a more elaborate description: https://www.ncbi.nlm.nih.gov/pmc/articles/PMC4342197/

Instead, I would just visually inspect the distribution through a histogram or normal Q-Q plot.

TL:DR

Don´t use the KS-Test; visually inspect the data instead.

$\endgroup$
3
  • $\begingroup$ I agree that this approach works well in some situations such as determining whether the normality assumption of residuals is satisfied in regression, but it looks like the OP is interested in "whether my data follows a particular distribution or not" so it seems likely that they will want to assess how well other distributions fit their data and compare the fits. This may be difficult using only a visual approach. $\endgroup$ Commented Dec 4, 2018 at 15:17
  • $\begingroup$ @RobertLong The same fallacies apply to any distribution not just the normal. If the sample size is too large small deviation can lead to a significant KG test. But you are right I am talking about normality although the question does relate to it. I will edit my answer to a more general one $\endgroup$
    – Janosch
    Commented Dec 4, 2018 at 15:22
  • $\begingroup$ The problem may be because of the large sample size and long tail but as @Robert said I tested for other distributions and want to justify that my data follows this particular distribution. So I want to compare other fits and say this is the good fit for my data. $\endgroup$
    – veda Lu
    Commented Dec 5, 2018 at 9:10
0
$\begingroup$

Finally, I got this. I hope this is right. The thing is previously I calculated the distance between two CDFs, not EDF and CDF.

1) This time I took a very small sample size i.e with 20 samples and calculated mu and sigma for sample distribution. The results are h= 0 (test failed to reject null hypothesis)
kstat=0.1167
p=0.9980enter image description here

Correct me for any mistakes.

$\endgroup$
2
  • $\begingroup$ This is singularly ill-advised and indeed fallacious. Indeed why stop there? You could reduce your data to just one positive value which would be totally consistent with any lognormal distribution whatsoever, so you have a perfect fit; and also a perfect fit to any other distribution which you might seriously wish to consider. No; there is no point in anything but using all the relevant data. $\endgroup$
    – Nick Cox
    Commented Jun 6, 2021 at 2:01
  • $\begingroup$ I agree with you. Taking the sample size of 20 to prove, it passed the test is completely faulty. I actually calculated the distance between wrong data after again which I have rectified. In my case, I have over a million data points and I had no choice but to take few points. But very small sample size will never justify the whole data. I ask here how can I prove for a large data when it is showing a fit visually but not reflected in the test?? $\endgroup$
    – veda Lu
    Commented Sep 9, 2021 at 10:44

Your Answer

By clicking “Post Your Answer”, you agree to our terms of service and acknowledge you have read our privacy policy.

Not the answer you're looking for? Browse other questions tagged or ask your own question.