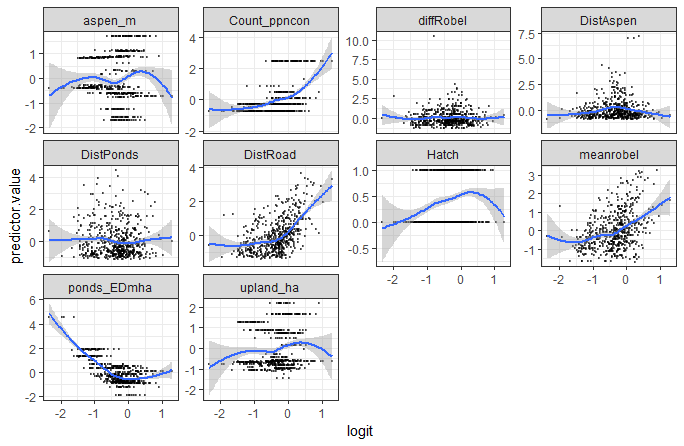
Prior to conducting a logistic regression of the 0/1 likelihood of a nest hatching or failing as a function of 9 continuous predictors, I plotted each of the standardized (mean = 0, SD = 1) predictors against the logit of the outcome (see below). An assumption of logistic regression is a linear relationship between continuous predictors and the logit of the outcome.
The assumption appears satisfied for covariates: diffRobel, DistAspen, DistPonds and maybe meanrobel. Ignore Hatch, that's the response variable.
It is obviously not satisfied for: aspen_m, Count_ppncon, DistRoad, ponds_EDmha, and upland_ha.
1) How can I properly meet this assumption using splines? I've read that it's better to apply splines than transform the data, but I'm looking for clarification on the use of splines. For example, ponds_EDmha (x) appears linear after -0.5 and DistRoad (d) appears linear until -0.5 . Thus, should I write y~(x-0.5)+(d+0.5) instead of y~x+d? This follows instructions on how to center raw data using that method, but it seems very strange.
The data need to be standardized because the covariates are in a number of different units; should I instead apply a spline prior to standardizing data, and if so how?
2) How to apply a spline where a bimodal relationship exists? Like with aspen_m and upland_ha
I'm looking for a simplified explanation of splines or other methods to address non-linearity in the context of standardized predictors, and perhaps some R code
Code to generate similar plots is found here:http://www.sthda.com/english/articles/36-classification-methods-essentials/148-logistic-regression-assumptions-and-diagnostics-in-r/
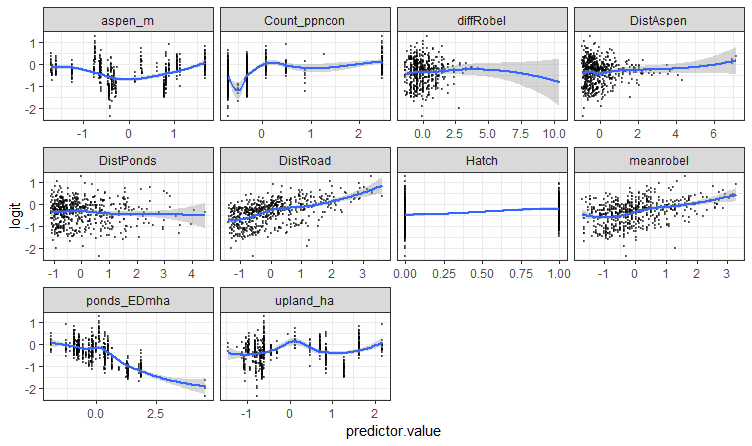
Edit: in response to comment I plotted logit ~ predictor values instead, and got the following plot. I'm now thinking that the relationships are linear enough not to worry about it. Count_ppncon isn't great but I intend to replace that covariate with a more relevant one anyway


