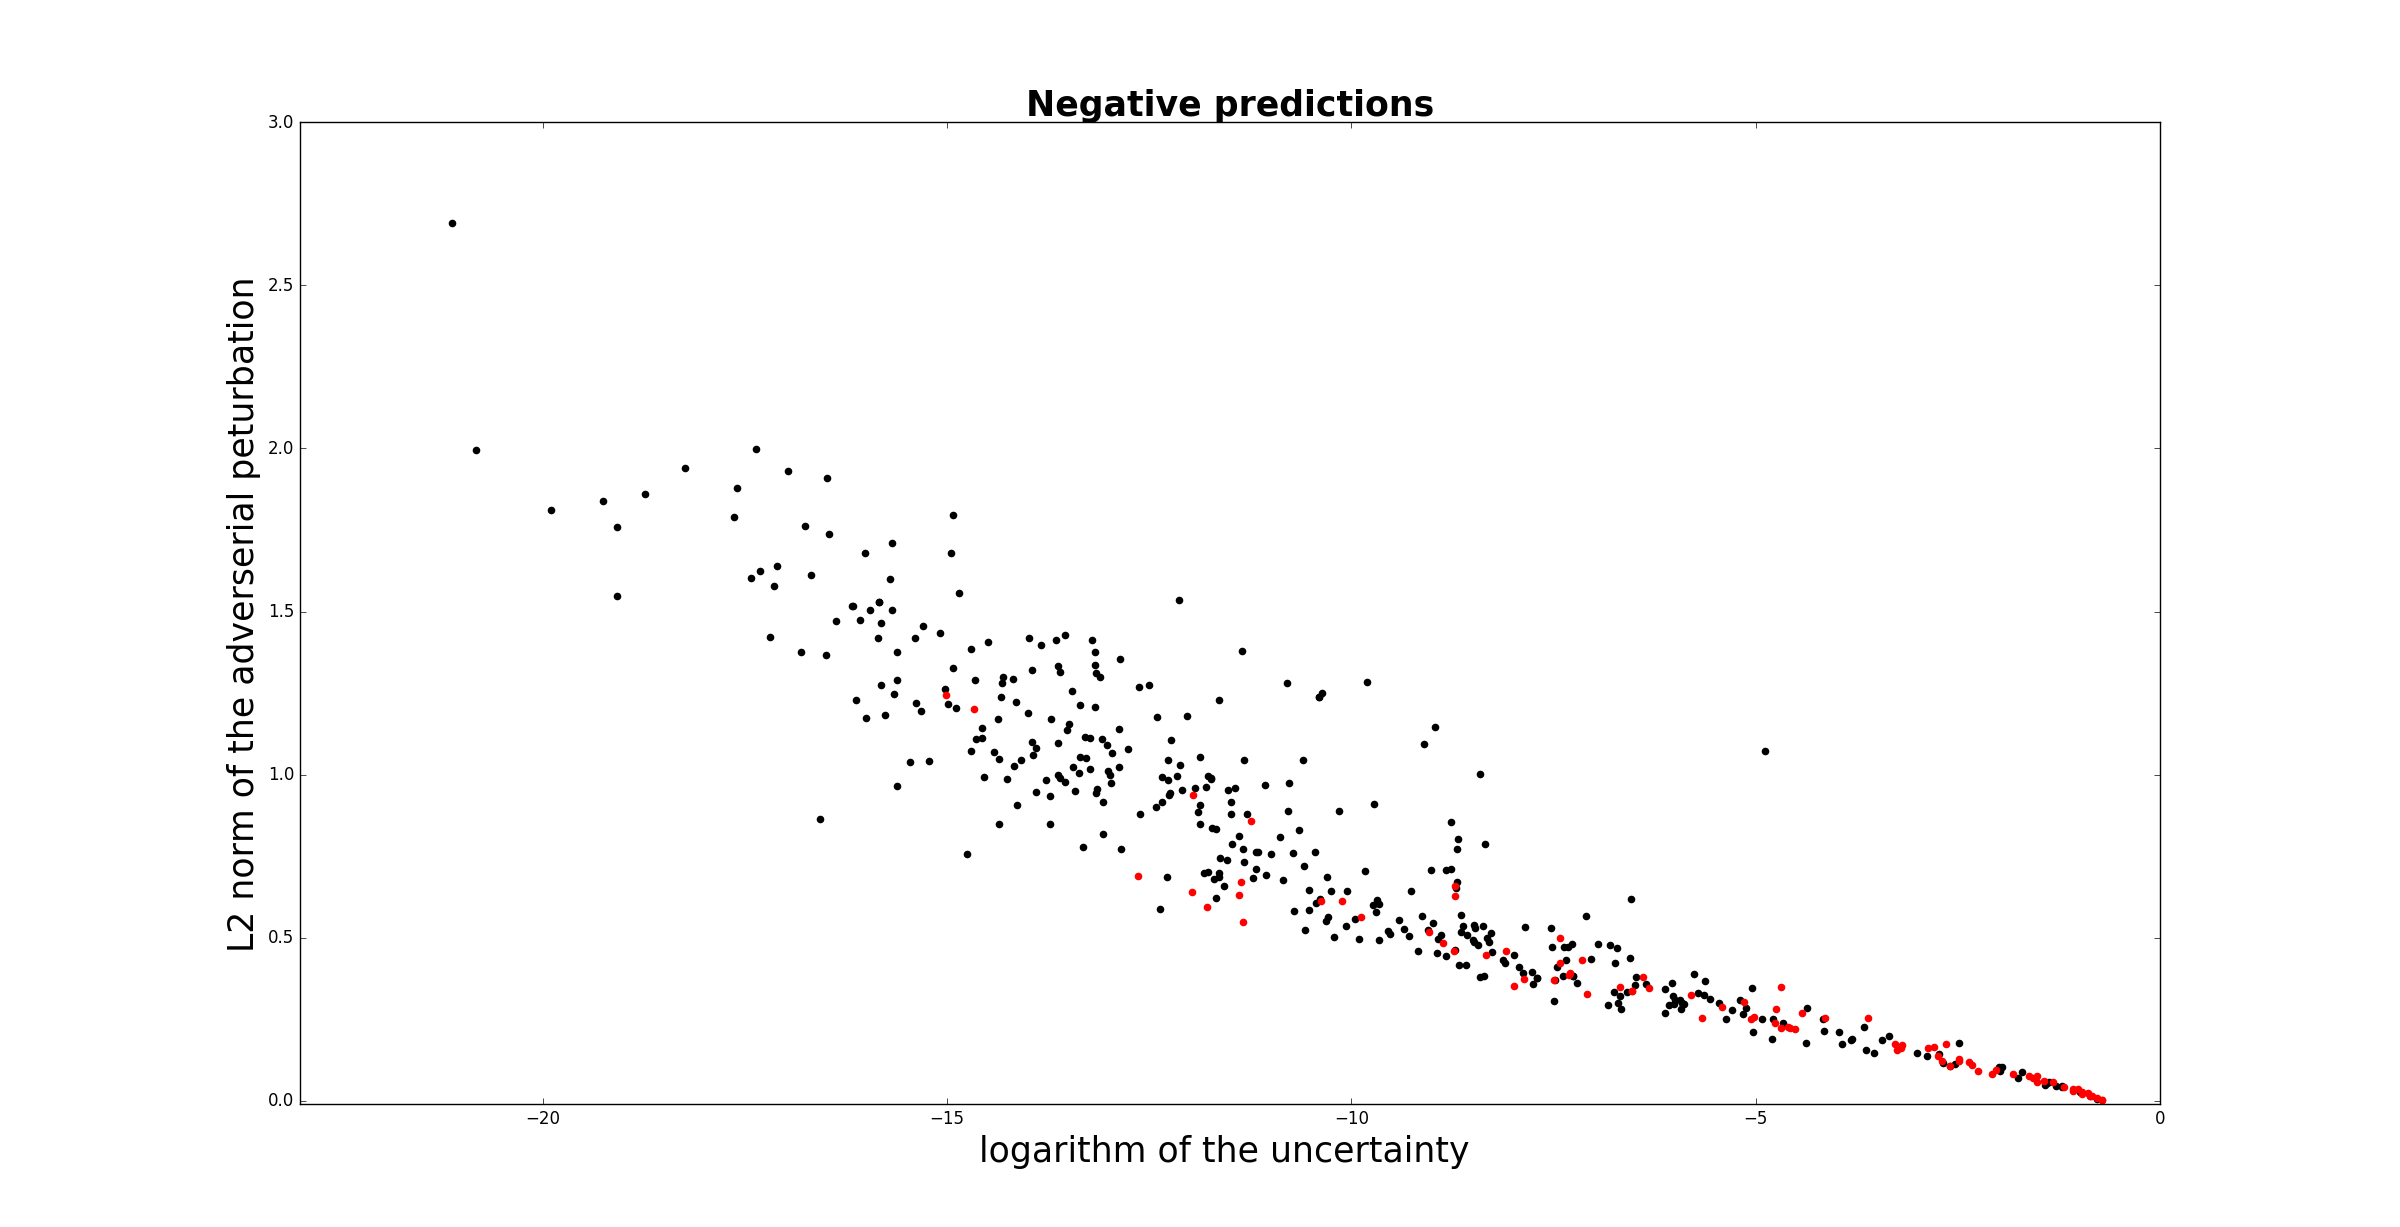
I have the following scatter plot. I want to do a statistical test to asses something along the following lines: "are the red dots on average higher/lower, given the y-coordinate". But I don't really know how I can do this in a solid way. I thought of fitting a regression trough the black dots and then compare how many red dots are higher/lower than the curve. But since many red dots are together in the lower left, I think this won't work that well (small imprecision in this zone will have huge effect).
Another alternative could be to do this: for each red dot: take the interpolation of the closest black dots on each size. And then compare weather this with a Bernouilli experiment with p=0.5 to get a kind of p-value. The problem with this is that is hard to asses how much independent trails there are since, a black dot can appear in multiple comparisons with red dots. So I don't what to do.
Are there standard ways to answer this question with this data set?

