3
$\begingroup$

One assumption of OLS regression is Linearity. To check whether the assumption holds, you can plot component + residual plots or partial residual plots. When a linear relationship is apparent, is's fine, if not you have to transform your data.

But what can you do when data transformation fails?

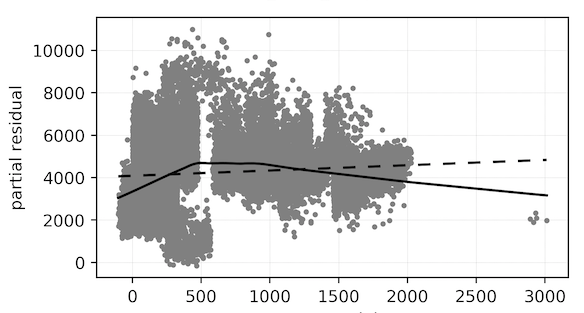
Here is an example of a component + residual plot before transformation:

enter image description here

The dotted line is a linear fit line and the other curve is a lowess curve (just a curve that smoothens the scatter plot). Clearly, the lowess curve is not linear.

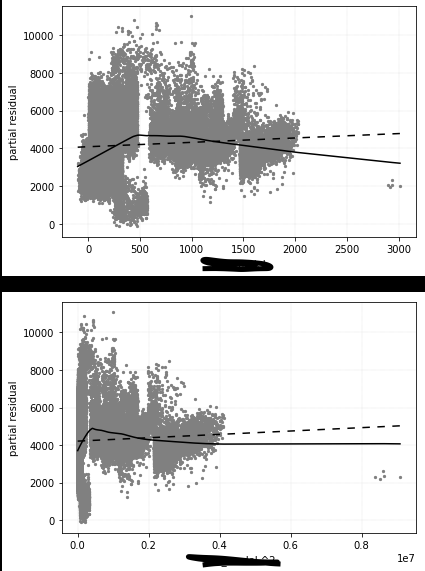
I already tried to use a 2nd and 3rd degree polynomial to transform the x-axis, but it did not work. The resulting lowess curve looked similar. Transforming the dependent variable is not sensible in my case because it would affect relationships of other variables in the multiple linear regression.

Partial Residual Plots for 2nd degree polynomial: enter image description here
What to do next?

$\endgroup$
4
  • $\begingroup$ You don't necessarily need to transform your data if the linearity assumption doesn't hold. Instead you could try a different distribution that better describes that data and perhaps improve the residual plot pattern - but you probably have done this already. What's the nature of your dependent variable? Have you tried a GAM (General Additive modeling) approach yet? This might be helpful: stats.stackexchange.com/questions/280344/… $\endgroup$
    – Stefan
    Commented Dec 16, 2018 at 17:55
  • $\begingroup$ Thanks @Stefan The 'probem' is that it is a study for the university and a prerequisite is to use OLS/ WLS regression. All other variables look fine, this is he only problematic variable. The variable on the x-axis is the duration of the treatment in days. $\endgroup$ Commented Dec 16, 2018 at 18:09
  • $\begingroup$ If you post a link to the data, I can perform an equation search using my zunzun.com open source web site's "function finder". It uses a genetic algorithm to find initial parameter estimates for non-linear equations, allowing the site to search through large numbers of both linear and non-linear equations - it has hundreds of known, named equations to search through. $\endgroup$ Commented Dec 16, 2018 at 20:24
  • $\begingroup$ What about WLS? Modelling the variance looks to be necessary, since the residual variance does decrease to the right. $\endgroup$ Commented Dec 17, 2018 at 9:08

1 Answer 1

1
$\begingroup$

There are other alternatives than data transformation to deal with nonlinearity. You didn't give specifics for your model, but my starting point today is to try splines. In R, something like

mod0 <- lm(Y ~ splines::ns(x, df=4) + <other covariates>, data)=yourdf)
summary(mod0)

An alternative, useful for choosing df (the number of degrees of freedom) automatically, is to use a gam (genaralized additive models.)

For examples, see Interpreting spline results, estimate conditional distribution from data, Interaction terms in regression when variables can be negative

$\endgroup$

Your Answer

By clicking “Post Your Answer”, you agree to our terms of service and acknowledge you have read our privacy policy.

Not the answer you're looking for? Browse other questions tagged or ask your own question.