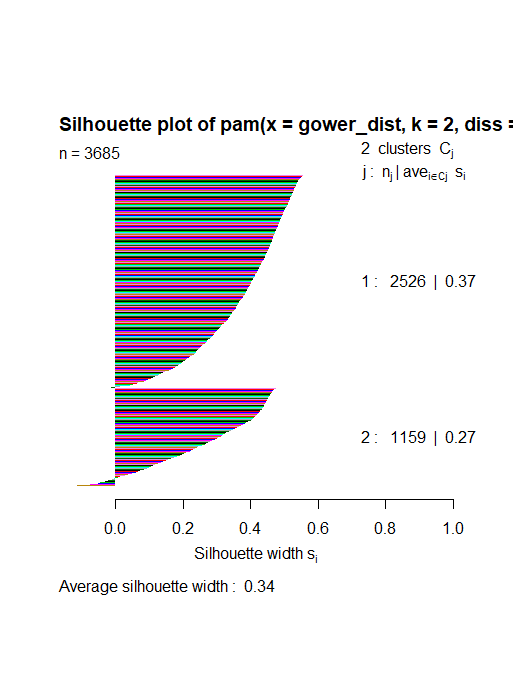
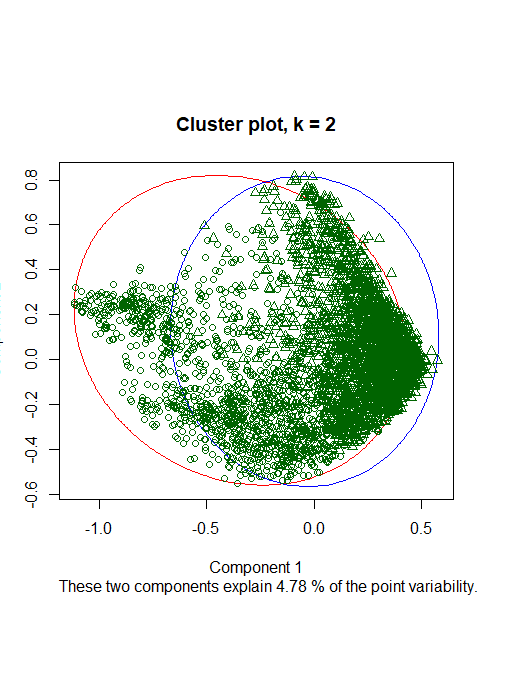
I have a mixed data and I have been searching for the best method to cluster it and I've chosen PAM. I am working btw with R. I've considered all the 17 variables of my data to cluster: 4 qualitative and the rest is continuous. When I plot my clustering, I got the following message under the plot: These two components explain 4.43% of the point variability. Which is very little right? Does that mean that method or the quality of my clustering is/are bad? what would be other measures for my clustering quality? What would recommend to me as a clustering method or as a way of improving the results of my PAM clustering?
The thing is that the visualization did work and also the distance function?But that very little point of variability the two components are explaining is source of worry! (My data is of almost 4000 observation with 17 var). I have to say that I am very new to R and data analysis in general!Any concise advise would be helpful for me! Thank you Happy new year!
Thanks a lot for your answer. The thing is that the visualization did work and also the distance function?But that very little point of variability the two components are explaining is source of worry!
(My data is of almost 4000 observation with 17 var).
I have to say that I am very new to R and data analysis in general!Any concise advise would be helpful for me! Thank you 

