2
$\begingroup$

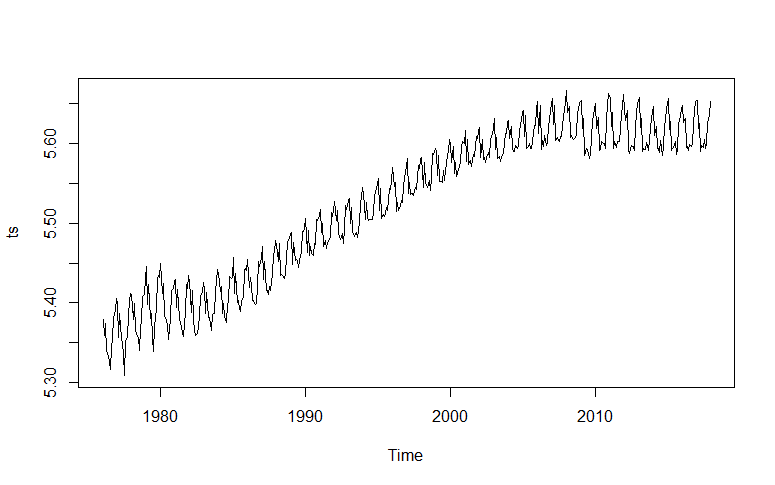
I have the following timeseries with a frequency of 12 (months). timeseries Since there is both a trend and seasonality, I differenced the timeseries. To determine the parameters p, q, P and Q for the SARIMA(p, 1, q)(P, 1, Q)_12 model, I look at the ACF and PACF of the differenced timeseries, shown below. differenced
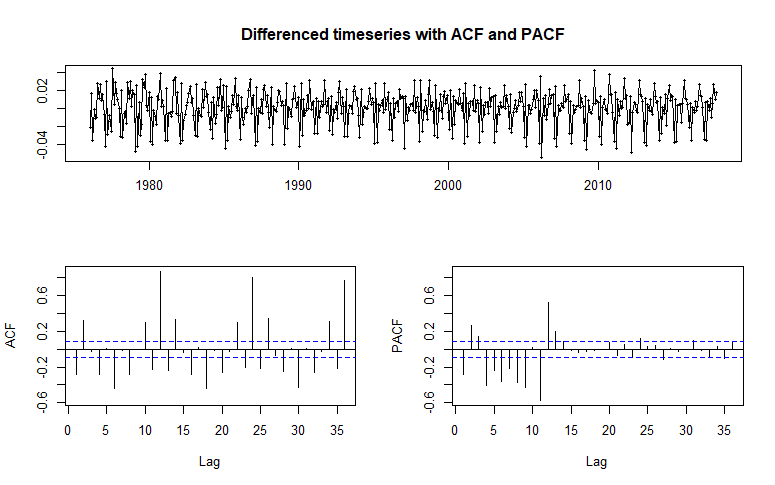
Now how do I determine the values for p, q, P and Q? I am having trouble reading the ACF and PACF. My guess is parameter P is 0 because the PACF does not show spikes at lag 24 and parameter Q is 2 because the ACF shows 2 spikes after lag 0, 12 and 24. Am I correct so far? About parameters p and q I am clueless.

As a note: auto.arima() gives a SARIMA(1,1,2)(0,1,2)_12 model.

$\endgroup$
4
  • $\begingroup$ Post your data... $\endgroup$
    – Tom Reilly
    Commented Jan 4, 2019 at 19:22
  • 3
    $\begingroup$ @TomReilly why? My question is about how to interpret the ACF and PACF plots shown in the question... $\endgroup$
    – Stan
    Commented Jan 5, 2019 at 8:25
  • $\begingroup$ The ACF and the PACF are summaries and often fail to correctly identify 1) the need and kind of differencing required 2) the AR and MA structure 3) the confounding ( and confusing ) presence of Pulses , Seasonal Pulses, Step/Level shifts and Local time Trends 3) The need for either Power transforms or wighted estimation to deal with non-constant error variance 4) the presence of time varying parameters . The interpretation ( what u are asking for) can be confused and confusing if 1,3,4, and 5 are in play. $\endgroup$
    – IrishStat
    Commented Jan 6, 2019 at 20:05
  • $\begingroup$ See @AdamO's insightful response to this question stats.stackexchange.com/questions/317734/… "The correlogram should be calculated from residuals using a model that controls for intervention administration, otherwise the intervention effects are taken to be Gaussian noise, underestimating the actual autoregressive effect." $\endgroup$
    – IrishStat
    Commented Jan 6, 2019 at 20:11

1 Answer 1

0
$\begingroup$

P is 0? P is 1 because acf shows declining acf at 12,24 36 and pacf shows spike at 12. When modeling seasonal series, it's usually easier to work on either non-seasonal side or seasonal side separately. Not both at same time. Pick which ever is most obvious in acf or pacf. Then proceed step by step. Clear up seasonal side then work on non-seasonal side or vice versa. So, here fit seasonal AR(1), then look at the residual acf and pacf for more clues. Keep adding terms step by step until residuals are white noise. Then you can try overfitting; adding an extra term and check whether it is significant.

$\endgroup$

Your Answer

By clicking “Post Your Answer”, you agree to our terms of service and acknowledge you have read our privacy policy.

Not the answer you're looking for? Browse other questions tagged or ask your own question.