5
$\begingroup$

For linear regression and many machine learning models, we use the same performance metric during the training and testing stage. For example, during the training stage, our machine learning algorithm is minimizing the mean-square-error and this is our performance metric. When we have got our model parameters, we apply our model to an independent test data set, on which, we look at the same performance metric, the mean-square-error. Almost always, the training performance is better than the test performance on that same performance metric.

However, I found that when we run logistic regressions, like in sklearn, the objective function that is used to get those parameters is maximizing log likelihood, which is no problem, as it is just one specific performance metric. However, the problem is: after you get the parameters, then you apply the model to a test data set, people are often looking at other metrics. For example, AUC, accuracy. Then here comes my question: as the metric during the training and testing stage are different, how this should help us to tune the model?

To be specific, you train the logistic regression using loglikelihood. After you finished the training, you can still compute AUC of this model on the training data set and we denote this score as $M_1$. Then you apply your model to a test data set and get AUC performance on the test data set, denoted by $M_2$. Then should I expected $M_1$ is better than $M_2$? I don't think so, as $M_1$ is not the objective to optimize during the training stage. I've also observed this phenomenon in some data set. Why not just use AUC or accuracy rate during the training stage as the objective function to be optimized by the algorithm, if in the end, we will be using AUC or accuracy rate as our performance metric?

$\endgroup$
1

2 Answers 2

1
$\begingroup$

A classifier's actual output isn't a sample's class but the probability of a sample belonging to each class.

However, we usually care about the classes, so we check which class has the highest probability and consider that to be the model's prediction. Then let's say we want to see how many predictions the classifier got right, so we'll measure the accuracy of the predicted classes with the actual ones.

The probability that the classifier assigns to each class can be viewed as how confident it is for a prediction. For example a class assigned a $99\%$ probability means that the classifier is very sure the sample belongs to that class.

During training, though, we want our classifier make correct predictions with high confidence and wrong predictions with low confidence. We want to penalize our model more if it is very confident about a wrong prediction. For this reason we need a continuous scale for measuring the model's performance during training.


Example

Suppose you want to train a classifier to predict a person's sex from his height. Intuitively, tall people will be men and shorter people will be women.

Because the classifier will many more samples of males with high heights, it will learn to produce a high probability for men in these heights (i.e. high confidence that tall people are males).

Likewise, it will see more samples of females with low heights and will produce a high probability for them (i.e. high confidence that short people are females).

Finally, it will see a balanced number of males and females in intermediate heights. This will cause it to be unsure (i.e. low confidence - probabilities around $50\%$) for people with an average height.

$\endgroup$
3
  • $\begingroup$ Theoretically speaking, can we also add another parameter, which is the threshold on the probabilities when we train the model? So when we train the model, we can use, say, accuracy as the objective function we are trying to optimize. If in the end, accuracy rate is THE metric for a specific problem (put aside those imbalance data issue), then will the above method be better in principle? $\endgroup$
    – KevinKim
    Commented Jan 16, 2019 at 3:00
  • $\begingroup$ The objective function should be continuous and in some cases differentiable. It needs to show you how close you are to your target, rather than if you got it right or not. Otherwise you wouldn't know in which way to update the model parameters to reduce the loss and make your model better. You can also read this article which elaborates a bit more. $\endgroup$
    – Djib2011
    Commented Jan 16, 2019 at 8:49
  • $\begingroup$ You might be interested in the links I posted as a comment to the original question. Assessing the probability is preferred. $\endgroup$
    – Dave
    Commented Jul 23, 2021 at 21:17
1
$\begingroup$

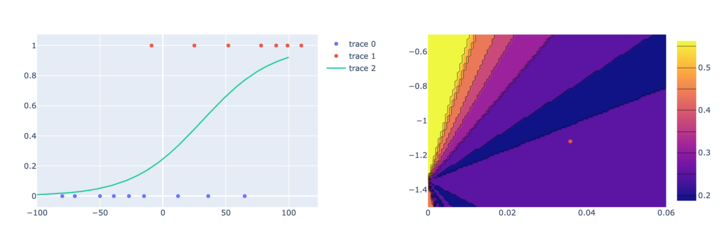
In the first plot below we can see some data points we are trying to classify into two groups on the left. We also have the function $p_{w,b}(x) = 1/(1+e^{-(wx+b)})$ for the values of $w$ and $b$ which minimize logistic loss.

Note: minimizing the logistic loss is the same as maximizing the likelihood that $p_{w,b}(x)$ generated the data in the sample.

On the right is a contour plot of the logistic loss as a function of the parameters $w$ and $b$. Here $w$ is on the horizontal axis and $b$ is on the vertical axis. Each point in this parameter space would give us a different logistic regression curve on the left. As you can see, this loss function is smooth, convex, and has a unique local minimum! A good candidate for gradient descent (or in this case, more advanced convex optimization algorithms) to minimize the loss function.

Data points, fit logistic regression, and loss function contour plot

Here is the same situation but using a contour plot of

$$\frac{\textrm{# incorrectly classified}}{\textrm{# of data points}}$$

Note that I am using a decision rule of predicting class $1$ if the model probability is greater than $0.5$. It is vitally important to understand that this decision step is distinct from the statistical modeling, and that a threshold of $0.5$ is not always appropriate. See this excellent answer for more details.

This is still a function of the same parameters $w, b$. I zoomed out some in this graph relative to the other graph to show more interesting features.

Data points, fit logistic regression, contour plot of fraction misclassified

Firstly note that this is a piecewise constant function! The fraction of samples which are incorrectly classified doesn’t change when you vary the parameters unless you pass over one of the sharp lines between different regions. So the gradient of this function is zero everywhere it is defined! It is not a good candidate for minimization using gradient descent. Minimizing a generic piecewise constant function is going to have to be, essentially, trial and error.

Finally note that logistic regression does not minimize the fraction misclassified! In fact, it doesn't even really make sense to talk about that without a decision threshold already in mind.

To summarize:

When we are fitting our model we want the model we get to accurately model the probability as a function of the features. We fit this by maximizing likelihood, which is equivalent to minimizing logistic loss. This minimization function is smooth as a function of the parameters, and so can be minimized using numerical analysis techniques.

We cannot discuss model accuracy until we have also implemented a decision rule: how do we take these probabilities and convert them into predictions? This is not part of modeling. The decision we make will depend on our use case (Is the decision expensive or cheap? What are the costs of misclassification both ways?). If we did attempt to "fit" the model to maximize accuracy we would run into a problem: the accuracy is a piecewise constant function of the parameters, so it is not amenable to minimization using any technique other than systematic search / trial and error.

Lastly: if all you are going to care about is classification accuracy, why even bother having a probability function at all? Just search for the cutoff value which gives you the best accuracy! In the multivariate case, just look for the hyperplane which best separates the data. You might be more interested in a SVM if this is your goal.

$\endgroup$

Your Answer

By clicking “Post Your Answer”, you agree to our terms of service and acknowledge you have read our privacy policy.

Not the answer you're looking for? Browse other questions tagged or ask your own question.