3
$\begingroup$

After determining that my Cox model with a particular covariate (drug) was violating the proportional hazard assumption, I took steps to incorporate a time-dependent continuous coefficient given how I believe my survival time would be best modelled.

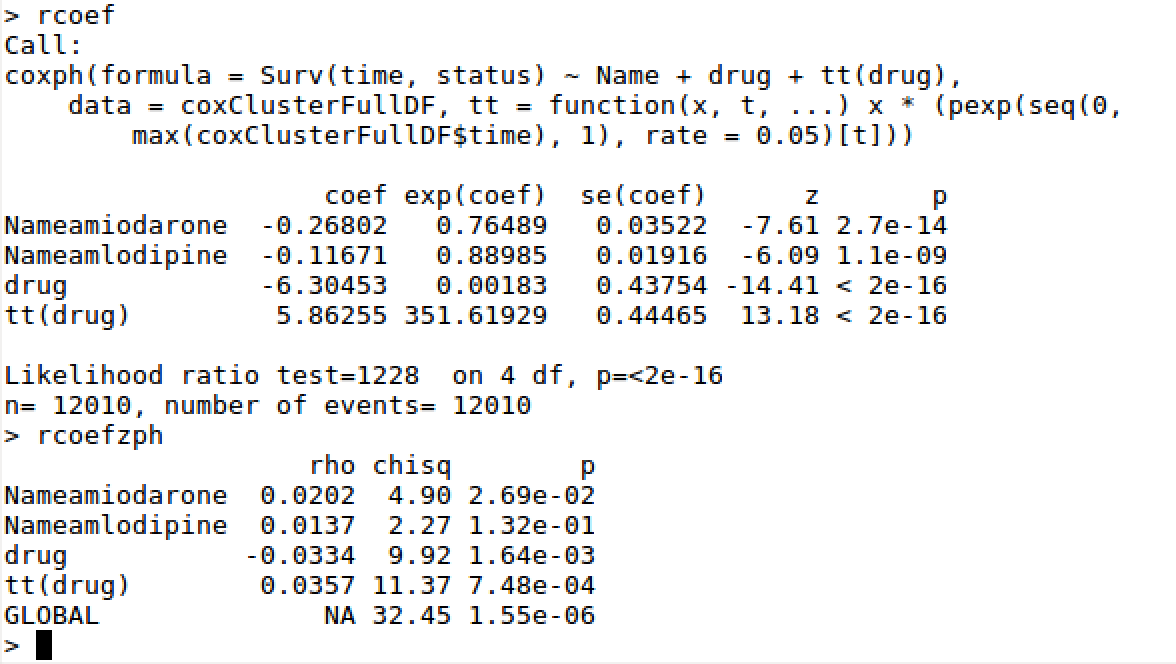
Firstly, without modelling time-dependence the cox model yields the following summary in addition to the assessment of the drug covariate:

enter image description here

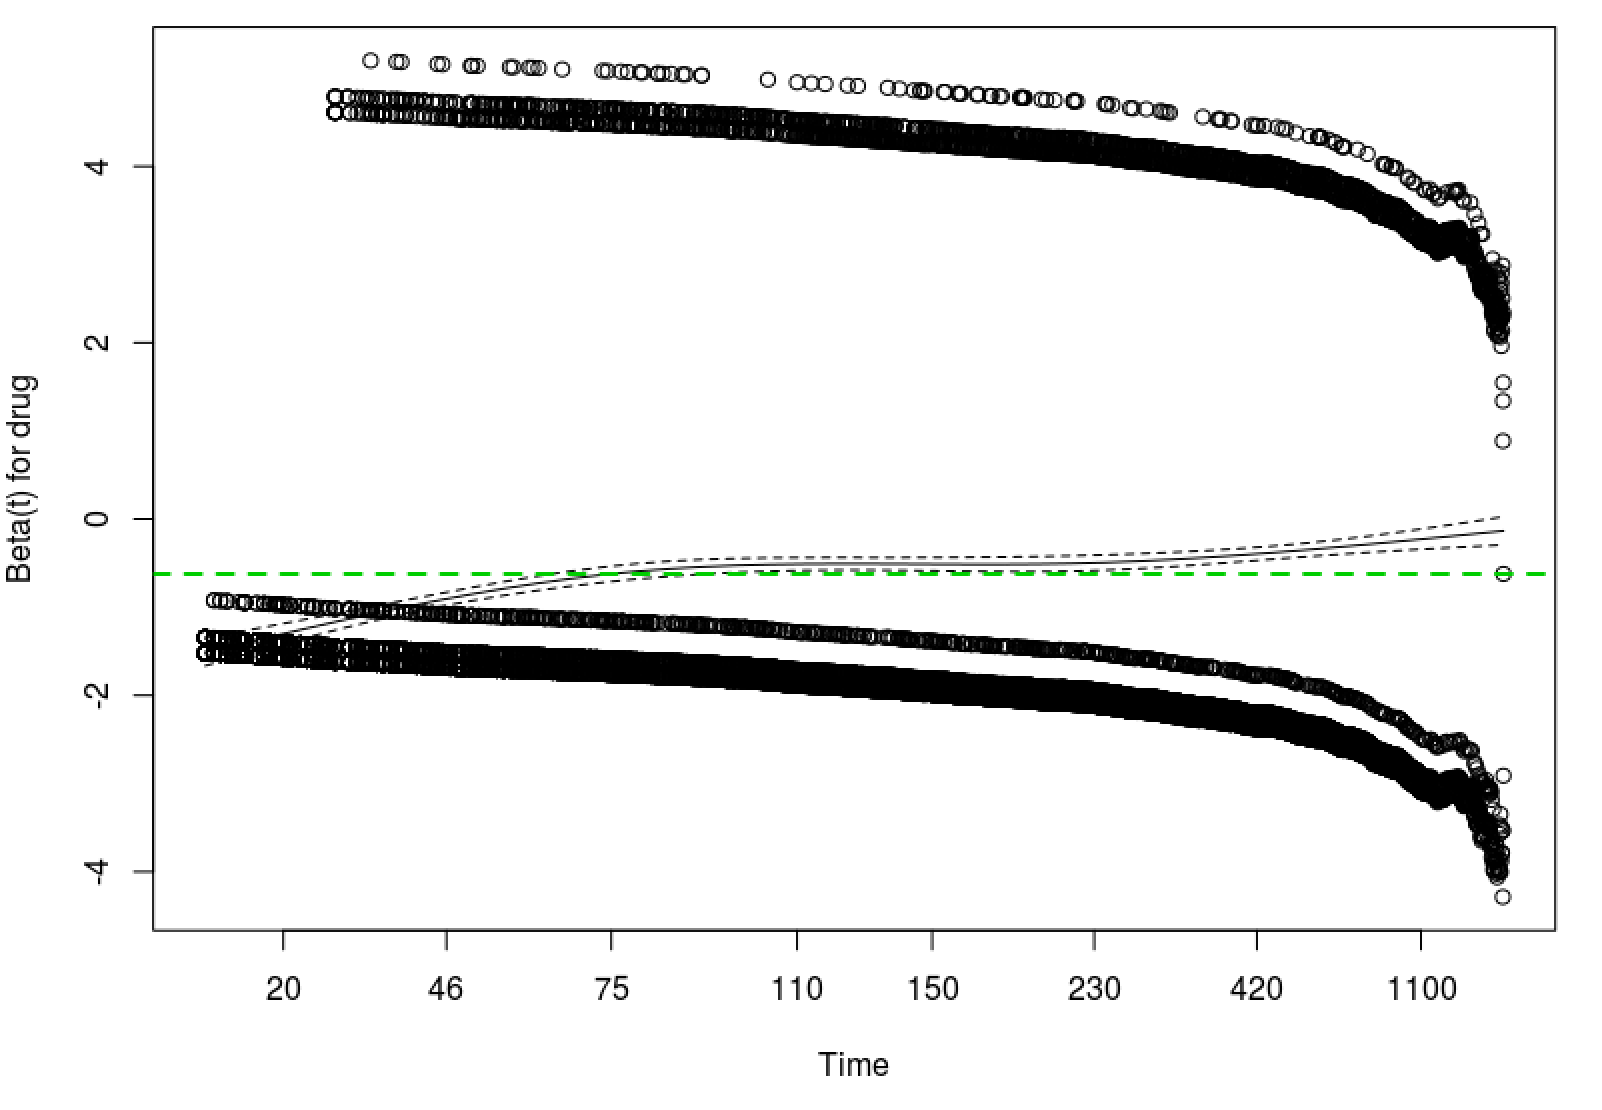
And as a plot, the drug covariate is not constant over time with respects to Beta (green line is the risk coefficient).

enter image description here

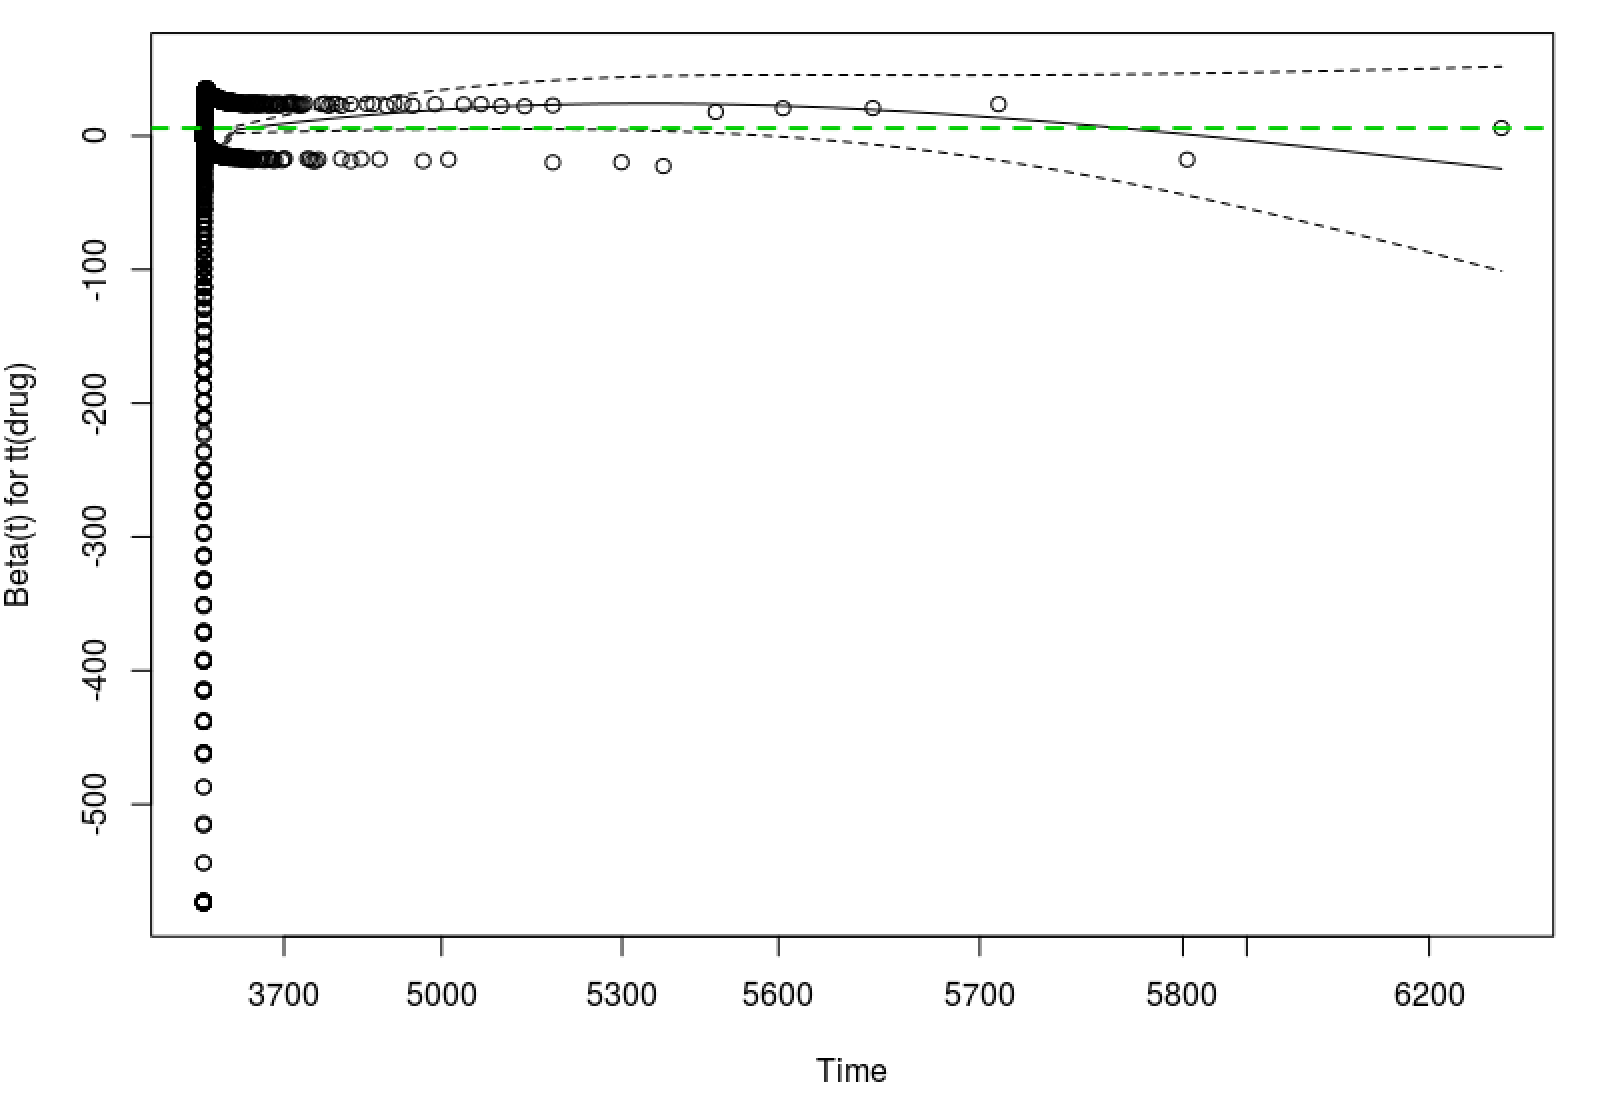
I have a good idea of how the effect the drug covariate should be having on the survival time i.e., this is a time to remission on patients undergoing treatment. Most patients get better sooner rather than later. Therefore, a rough estimate was to use an exponential probability of going into remission. The adjusted model, now with a time-dependent coefficient for Drug looks pretty awesome:

enter image description here

However, when I actually look at the significance, this new model is still suggesting that drug continues to violate the proportional hazard assumption.

enter image description here

Given the above plot, I can't see why drug continues to violate. I would appreciate any thoughts. Perhaps, one thought would be that the leftmost time interval on the Beta vs time plot, doesn't actually fit the drug coefficient which I use an exponential function to model?

EDIT #1

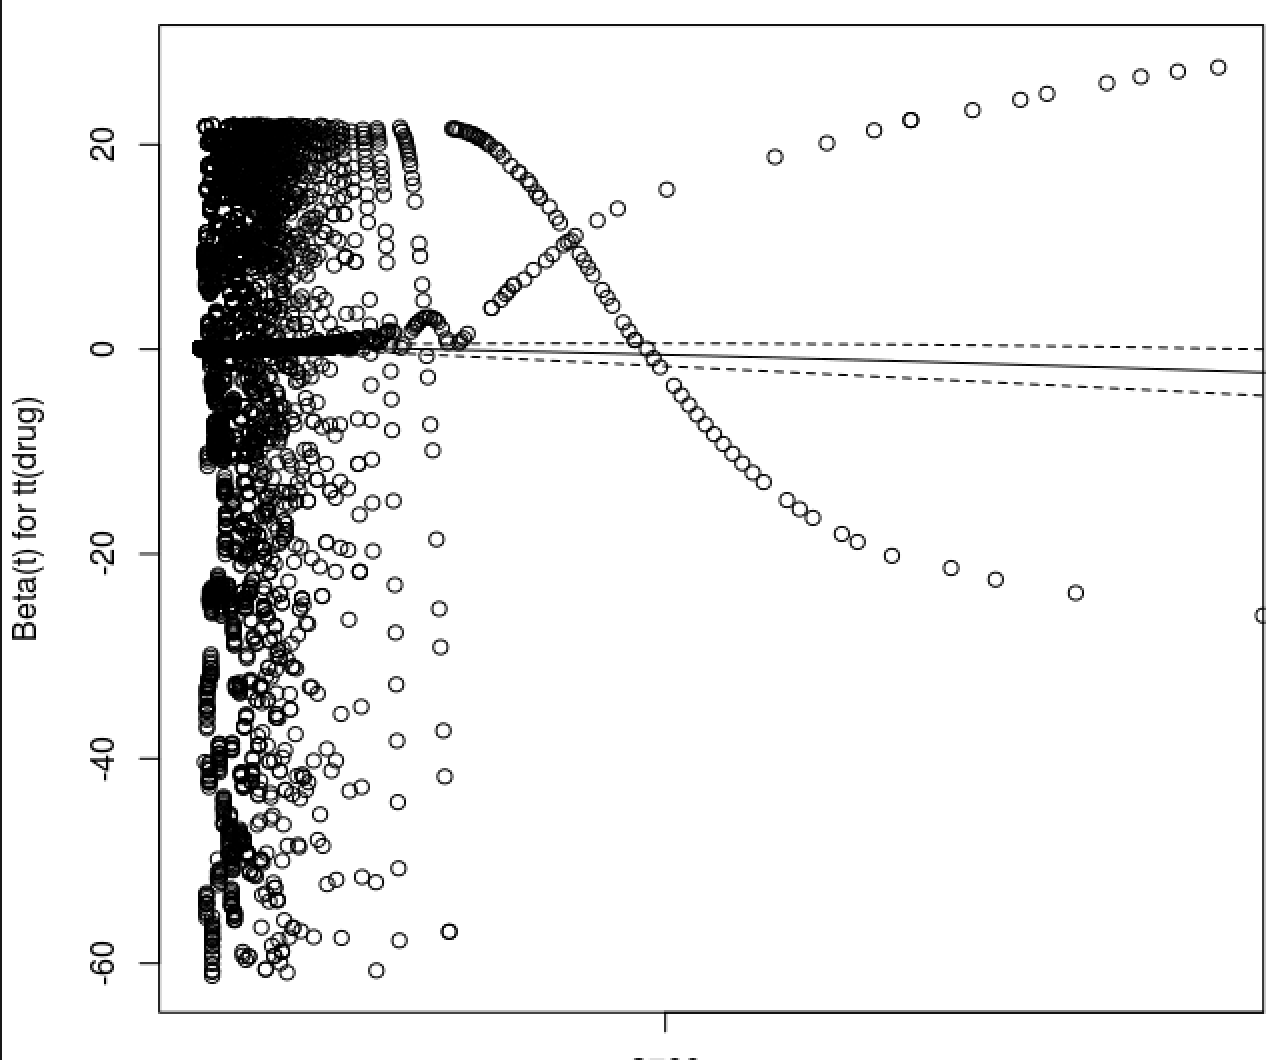
Zooming in near time=0 I can see exactly why fitting this particular function did not resolve the issue of correcting a time-dependence covariate.

enter image description here

Sadly, I have no idea to progress from here. We really need this to be time-dependent.

EDIT 2

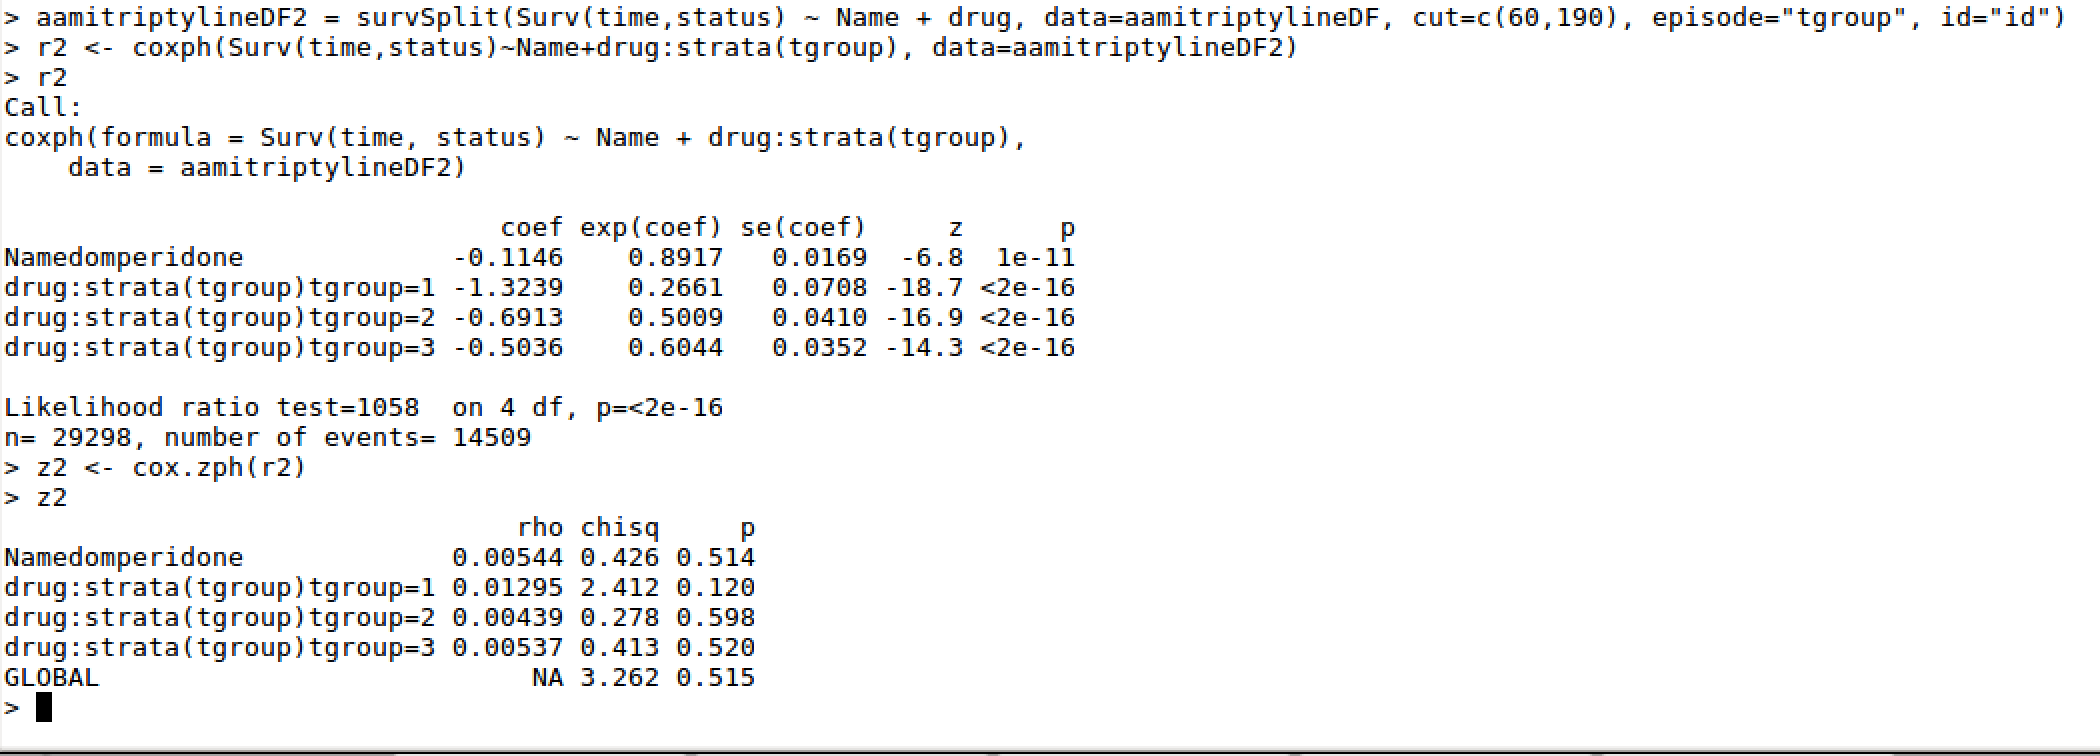
I gave the survSplit approach a try: Before implementing time dependence: enter image description here

Which resulted in the following plot: enter image description here
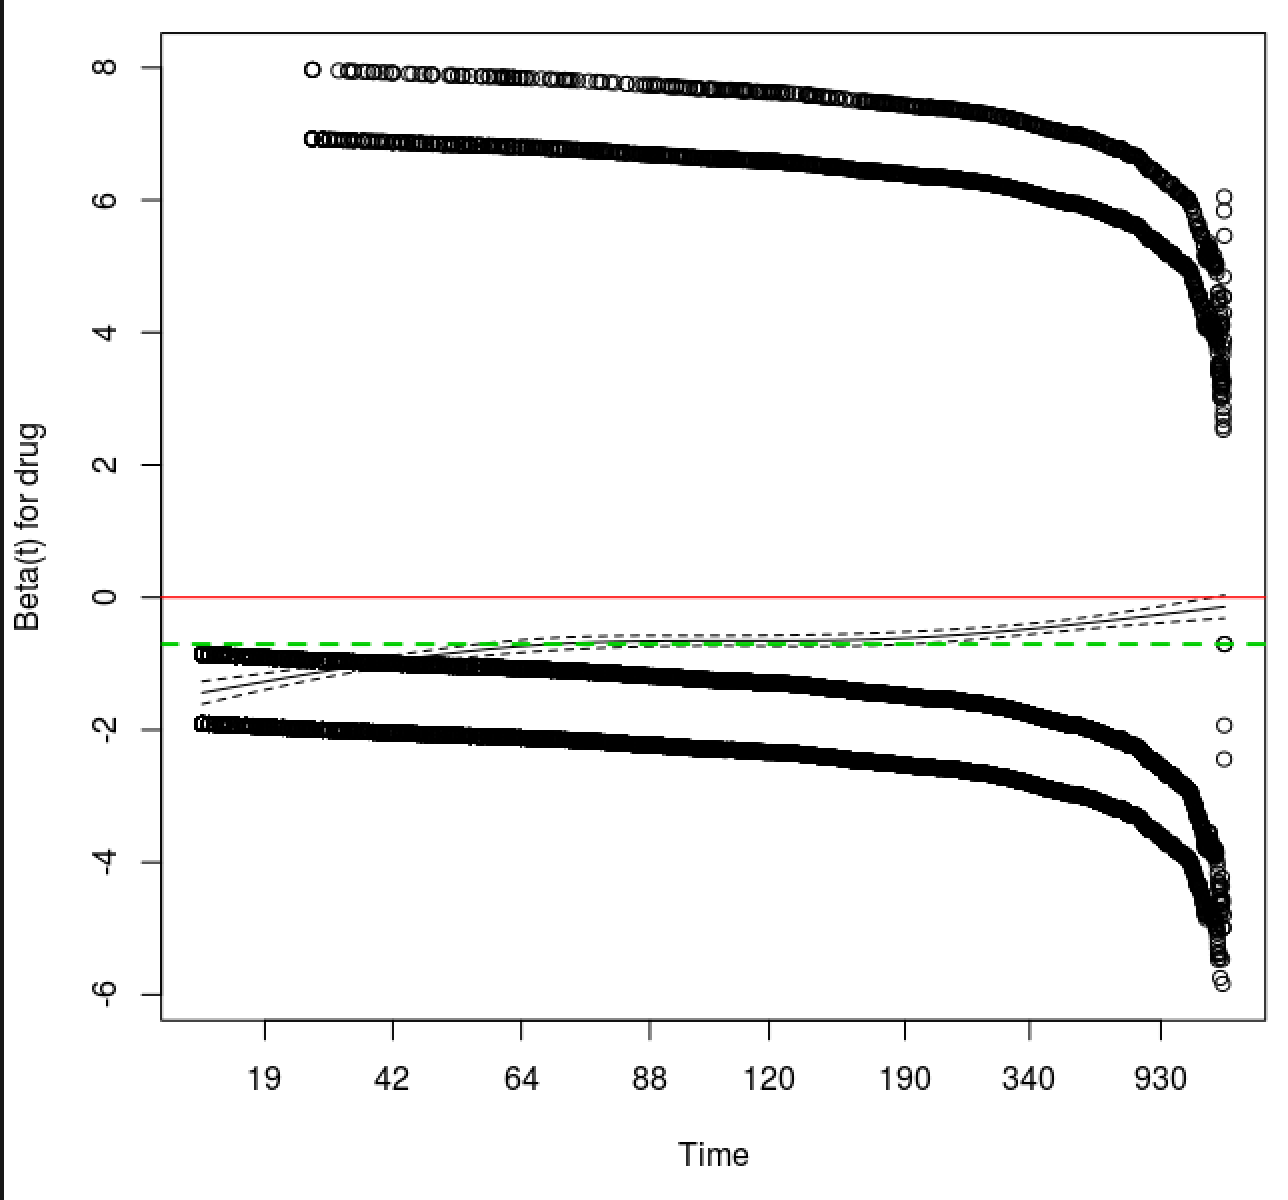
Taking this plot, I cut the survival time at the points at which the beta(t) for drug crossed the coef line (green dashed). I then refit the cox model and tested the coefficients. It appears to work:

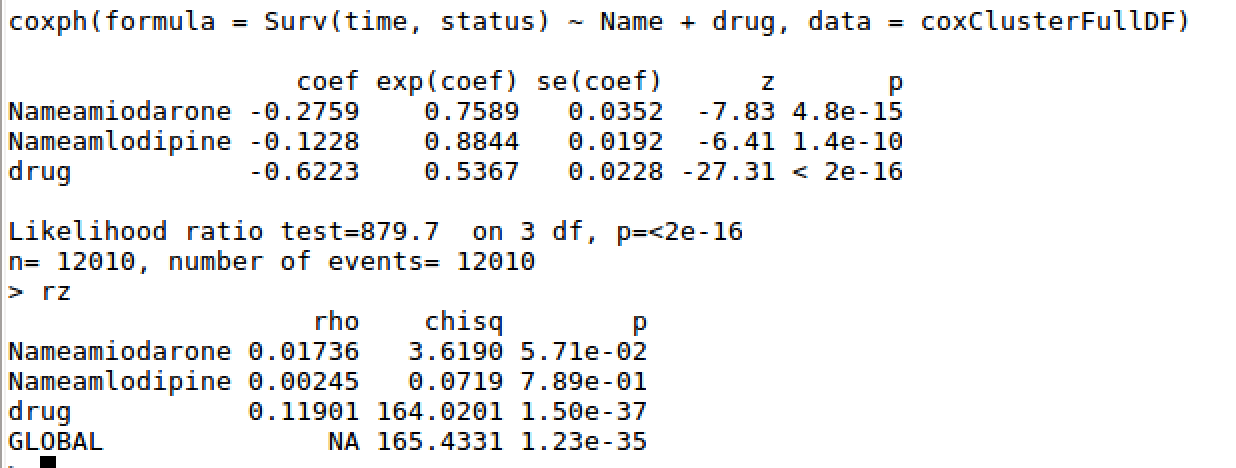
enter image description here

$\endgroup$
6
  • $\begingroup$ Along with my answer, I'm very interesting in how you chose your time-tranformation function, would you mind telling me ? $\endgroup$ Commented Feb 27, 2019 at 11:11
  • $\begingroup$ Of course. I was going to reply to your full answer a little later; it's been very helpful. I'll put up a screenshot and include an edited section shortly. Note, the time-transformation here was an approximation of what I was guessing the probability to remission should look like. I'll explain in detail shortly. $\endgroup$ Commented Feb 27, 2019 at 11:43
  • $\begingroup$ Are you sure that this tt function is OK ? Its exp(coef) is incredibly high ! Have you ever tried to use age like many (link) ? $\endgroup$ Commented Mar 4, 2019 at 20:34
  • $\begingroup$ I honestly don't know what to add to the tt function - that is the precise problem I have. I've gone through that link several times, along with an excellent book on extended cox regression. But surely, the tt function is always unique to the data at hand. Isn't there some kind of function that minimises the GLOBAL p-value? $\endgroup$ Commented Mar 4, 2019 at 20:55
  • $\begingroup$ If it was that easy you would know ¯\_(ツ)_/¯ But it seems that others use pspline to best fit the data at hand. I don't know enough to help you more on that unfortunately. Have your tried tt=function(x, t, ...) pspline(x + t/365.25) to adjust on age, or tt = function(x, t, ...) x * log(t+20) like I've seen on the previous link? $\endgroup$ Commented Mar 5, 2019 at 12:44

1 Answer 1

2
$\begingroup$

Take a look at the residuals points of your corrected plot: they are very skewed. I guess that if you zoom in around 3000, you'll see that the curve is far enough from your calculated beta to interfere with the zph test.

ZPH test, while very useful, should be used with caution though. A bit like normality tests, it can give significant results when there is no problem, and vice-versa, and that is why you look at plots.

But since your residuals interfere with you zph test, they could also interfere with your coefficients. Maybe you could test several time transformations and check if your betas change a lot when your plot changes significantly (like between you normal time and your corrected time). If not, I guess it could mean that the model is robust to the PH assumption. If yes, I guess you will have to find a better time tranformation function. But again, there is no real consensus on what to do here that I've heard of.

EDIT:

When you look at your first plot (without time transformation), it seems that drug effect is different before and after time 75. As you can see on this excellent link, you could thus use a "step function" (chap 4.1, page 17) to estimate a different beta for these two periods.

coxClusterFullDF2 = survSplit(Surv(time, status) ~ ., data= coxClusterFullDF, 
                              cut=75, episode= "tgroup", id="id") #maybe replace id
coxph(Surv(tstart, time, status) ~ Name+ drug:strata(tgroup), data=coxClusterFullDF2 )

Another possibility would be to use a time transformation looking like this: tt = function(x, t, ...) iselse(t<75, x*t, x). With a time transformation, your model is read as:

$beta_{drug}(t) = beta_{drug} \times drug + beta_{tt(drug)} \times tt(time)$

With this function, this would translate as:

$t<75 (linear) \rightarrow beta_{drug}(t) = beta_{drug} \times drug + beta_{tt(drug)} \times time$ $t>75 (constant) \rightarrow beta_{drug}(t) = (beta_{drug} + beta_{tt(drug)}) \times drug$

As you can read in the pdf, the value of 75 is quite arbitrary and testing the significance of the difference between $beta_{drug}$ and $beta_{tt(drug)}$ is difficult.

$\endgroup$
7
  • $\begingroup$ I have updated the original question to illustrate what's actually going on near time=0. $\endgroup$ Commented Mar 4, 2019 at 19:46
  • $\begingroup$ @AnthonyNash Is there any way you could color your plot by drug group? Also, your plot is quite not like what I'm used to (try googling "schoenfeld residuals"). Do you have a lot of very little followup times and few long followup times ? $\endgroup$ Commented Mar 4, 2019 at 20:23
  • $\begingroup$ Hi Daniel, I'm not sure what you mean by colouring by drug group. The covariate drug is just a binary factor to indicate whether the drug in question was present in that particular survival time sample. e.g., Drug_Name Incidence_Time Status drug I have a huge amount of little follow-up time, as it is made from repeat prescription data and clinical visits i.e., a UK NHS general practitioner. There are also a lot fewer long followup times. You are quite there. $\endgroup$ Commented Mar 4, 2019 at 20:53
  • $\begingroup$ @AnthonyNash Hi Anthoniel (joke), I've edited my post again, I hope this can help you $\endgroup$ Commented Mar 5, 2019 at 18:41
  • $\begingroup$ Very helpful, Dan! I'll try these out and put up an update. $\endgroup$ Commented Mar 6, 2019 at 9:06

Your Answer

By clicking “Post Your Answer”, you agree to our terms of service and acknowledge you have read our privacy policy.

Not the answer you're looking for? Browse other questions tagged or ask your own question.