2
$\begingroup$

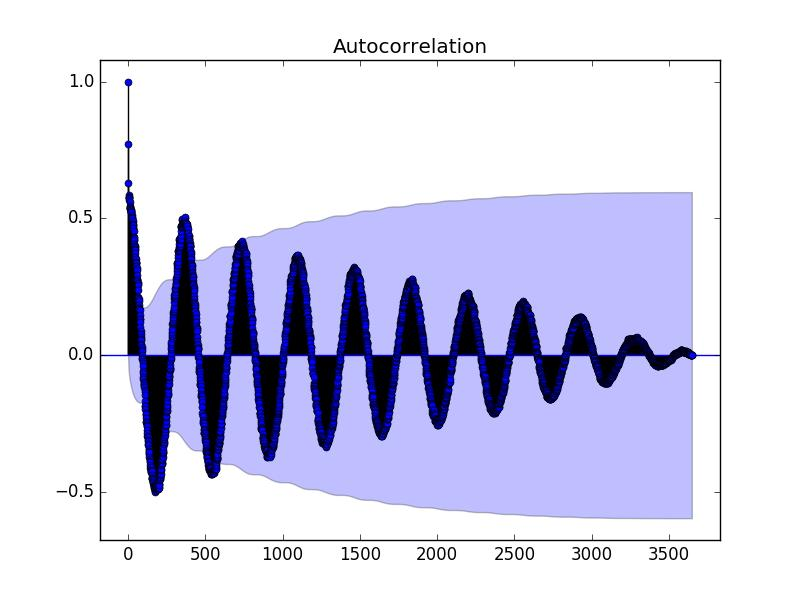
ACF plot

Please see ACF plot attached (Python). I would like to understand why the shaded region of my plot takes a curved shape?

My understanding so far is that the confidence band changes because the variance is estimated by Bartlett’s formula however:

  1. I would like to understand this formula and why it’s used on a ACF?

  2. Has this got to do anything with the moving average process?

  3. How does Bartlett’s formula for variance affect the confidence band? What are its assumptions?

$\endgroup$

1 Answer 1

-1
$\begingroup$

The bands are around the hypothesized value of 0.0 and approach limiting values based upon the sample size . They are very approximate .

$\endgroup$
2
  • 1
    $\begingroup$ Thank you for this....but can you please elaborate on what you mean by the hypothesised values? What does 'approach limiting values' mean? $\endgroup$
    – Henry. P
    Commented Mar 20, 2019 at 0:04
  • 1
    $\begingroup$ the null hypothesis i.e. the hypothesized value is 0.0 ...the center line of the probability distribution (range) ... if you take the series .5,.75.,875..9375,.... they approach a limiting value of 1.0 . in the same style the theoretical cl's approach a limiting value based upon the sample size. $\endgroup$
    – IrishStat
    Commented Mar 20, 2019 at 0:06

Your Answer

By clicking “Post Your Answer”, you agree to our terms of service and acknowledge you have read our privacy policy.

Not the answer you're looking for? Browse other questions tagged or ask your own question.