1
$\begingroup$

I was working with R and SPSS trying to determine Cohen's Kappa for a dataset. I decided to test the two and see if they would end up getting the same numbers. However, they did not. I was wondering if there might be something I am doing wrong, but I cannot think what it would be.

R code:

library(irr)
var1<-c(94,25,1,6,3,7,2,9,14,13,12)
var2<-c(90,23,1,7,3,7,2,8,13,12,12)
vars.test<-cbind(var1,var2)
kappa2(vars.test)

This results in a Cohen's Kappa of 0.416 and a p-value of 4.49e-08. However when I test this within SPSS I get a a Cohen's Kappa of 0.926 with a p-value of 0.000. What is the issue?

How I entered it in SPSS: Column 1 is rater 1 and Column 2 is rater 2. Column 3 is the frequency. The numbers in column 1 and 2 refer to categories, with 12 being None observed. This is not scaled data or anything funky, simply the number of observed events for a category.

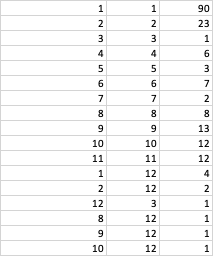
SPSS

$\endgroup$
3
  • 1
    $\begingroup$ I could not understand the input in R. It seems to be not the same data as in SPSS $\endgroup$
    – ttnphns
    Commented Mar 23, 2019 at 13:22
  • $\begingroup$ hmm. How would I input the information I used in SPSS into R then? As in the correct format? $\endgroup$ Commented Mar 23, 2019 at 13:25
  • 1
    $\begingroup$ I'm not R user, but the documenattion of irr package is quite clear. You have to enter two-column caseweise data, or a two-column aggregared data plus a weight column (same as you did in SPSS). But I can't understand at all how your 11 pairs in R correspond to your SPSS data. $\endgroup$
    – ttnphns
    Commented Mar 23, 2019 at 16:31

1 Answer 1

2
$\begingroup$

I match the R results in SPSS by inputting them as two columns. The R Kappa output refers to 11 subjects and 2 raters. As @ttnphns noted, the data input to R don't seem to correspond at all to what was input to SPSS.

I'm pretty sure the R results would match those from SPSS if the data were input properly. I have to believe there's a way to input aggregated counts of data somehow to the irr package to apply kappa2 to it, but I don't see how to do it. It looks like you have to actually feed it two columns of paired ratings, which would require manually or otherwise constructing the 187 pairs of values in two columns.

$\endgroup$

Your Answer

By clicking “Post Your Answer”, you agree to our terms of service and acknowledge you have read our privacy policy.

Not the answer you're looking for? Browse other questions tagged or ask your own question.