Thinking ahead, before you have done the experiment: II some "Nice" packets ought to have shorter round-trip times and other "Ugly" packets ought to take much longer, then there is a big advantage in doing a paired test. So design the experiment to keep track of pairs.
If you have already done the experiment and happened to keep track of pairs: You might see if Protocol A scores are correlated with their respective Protocol B scores. If there is significant correlation, the advantage of doing a paired test may be considerable.
If you have data with no tracking of A/B pairs: Then you'll have to do a 2-sample test.
Your chances of finding a significant difference between protocols is lower in this case.
Example: Consider vectors x1 (Protocol A) and x2 (Protocol B) of normal data, each with $n = 100$ observations, and with pairing. They have the following sample summaries:
summary(x1); sd(x1)
   Min. 1st Qu.  Median    Mean 3rd Qu.    Max.
  33.58   43.73   47.31   48.90   53.30   67.84
[1] 7.030837   # StDev

summary(x2); sd(x2)
   Min. 1st Qu.  Median    Mean 3rd Qu.    Max.
  34.53   44.73   48.27   49.91   54.36   68.82
[1] 7.028975   # StDev

cor(x1, x2)
[1] 0.9998922  # Sample correlation
Then a paired t test has P-value 2.2e-16 (essentially 0), so there is a very clear difference between Protocols A and B (B has slightly, but significantly, longer times. Whethe the slight difference is of practical importance would be another matter, for discussion among writers and users of protocols.)
However, if paring is lost (order of observations within vectors is scrambled), then a paired test
is not possible. A Welch 2-sample t test has
P-value 0.3137, which provides no hint of
significance. (The relatively large variability among individual packets has created a 'statistical fog', obscuring the small difference between protocols.)
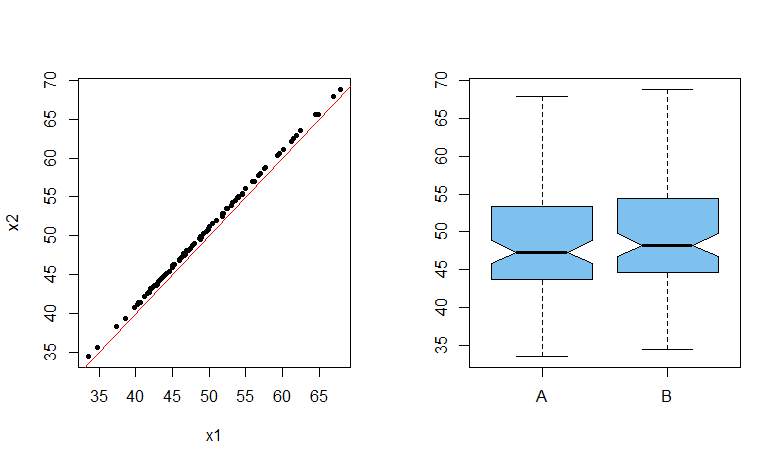
Graphical displays of data: (1) The scatterplot of x1 and x2 at the left is possible because the $i$th element of each vector is for the $i$th packet. In this extreme case, every one of the
$n=100$ packets had a quicker time for Protocol A than for B. (All points lie above the red 45-degree line.)
(2) By contrast, if there is no paring we can compare overall times of the two protocols with two boxplots, but with not much evidence of a difference between protocols. ('Notches' on the sides of the boxes show overlapping nonparametric confidence intervals for A and B median times.)

Note: Whether t tests can be used depends on having data that are nearly normal. But there are ways to do both paired tests and tests with two (independent) samples for non-normal data.

