1
$\begingroup$

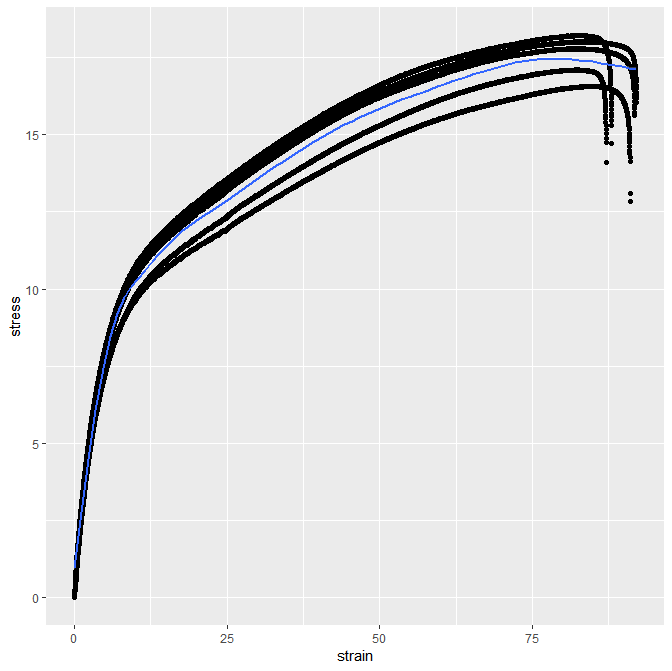
I am currently working on curves generated in tensile tests of polymer specimens. Here, I try to generate a mean curve of five data sets generated at the same composition of the samples. Unfortunately, the resulting curve is not a function but has a vertical section which is why a simple smooth is not sufficient. Is there a way to fix the smoothed curve to a defined end point in R? Or an even better way that I did not see yet?

I already tried a geometric_smooth() from ggplot2 on all data points but it did not work as wished.

My current approach:

data <- read.csv("data.csv", header = TRUE, sep = ";")
ggplot(data, aes(y=stress, x=strain))+geom_point()+geom_smooth()

In the figure, you can see that the blue average curve does not fit the actual curves near their end points, probably due to the vertical sections. That's why I want to fix it to the mean end point. Additionally, I would like to fix it to (0|0) as the blue mean curve starts somewhere above it which does not fit the actual behaviour.

enter image description here

$\endgroup$
2
  • $\begingroup$ To the state the obvious: geometric_smooth is for a quick visualisation. If we actually need a proper curve fitting, it is not the proper tool for the job. It is not a bad tool just it is not designed to be curve fitting tool but rather a way to show a smoothly varying trend conveniently. $\endgroup$
    – usεr11852
    Commented May 8, 2019 at 20:49
  • $\begingroup$ You may find it considerably easier to approximate $\exp(\text{stress}|\text{strain})$ (possibly a weighted fit, to account for the effect of the transformation on variance); you can then do a first order bias correction when transforming back. It won't be certain to work perfectly but is likely to do better if you're sticking to quick and simple function approximation tools like this one. $\endgroup$
    – Glen_b
    Commented May 9, 2019 at 5:14

1 Answer 1

1
$\begingroup$

I believe you are looking for a spline with boundary conditions. A quick Google search for "spline with boundary conditions R" produces quite a few results and functions that you may be able to use.

https://stat.ethz.ch/R-manual/R-devel/library/splines/html/bs.html

https://stat.ethz.ch/R-manual/R-devel/library/splines/html/ns.html

You could also consider piecewise polynomials wherein you try to fit polynomials of different degrees to different sections of your data.

Non-parametric methods are known to have weaknesses at boundaries. You may want to look into that before you start.

I'd suggest Chapter 7 of An Introduction to Statistical Learning with Applications in R titled Moving Beyond Linearity to get started with splines. There should be a free copy of this book available for download online.

$\endgroup$
1
  • 1
    $\begingroup$ I think that while you are correct to suspect boundary conditions play a part at this, it is not the main things. The obvious issue is that certain curves "taper off" (?) before other and this not adequately captured. The OP do not want an "arithmetic" mean here but rather a "warped" mean. $\endgroup$
    – usεr11852
    Commented May 8, 2019 at 20:53

Your Answer

By clicking “Post Your Answer”, you agree to our terms of service and acknowledge you have read our privacy policy.

Not the answer you're looking for? Browse other questions tagged or ask your own question.