10
$\begingroup$

I'm trying to fit a linear model on some data with just one predictor (say (x,y)). The data is such that for small values of x, the y values give a tight fit to a straight line, however as x values increase, the y values become more volatile. Here is an example of such data (R code)

    y = c(3.2, 3.4, 3.5, 3.8, 4.2, 5.5, 4.5, 6.8, 7.4, 5.9)
    x = seq(1,10,1)

I'm curious to know if there exists any power transform (Box cox perhaps?) that lets me get a better fit for the data than simply doing a linear fit as shown below.

    fit = lm(y ~ x)
$\endgroup$
3
  • 1
    $\begingroup$ As I understand it, the purpose of transformations like Box Cox is not to get a better fit, but to meet the assumptions of the model. That might get a better fit, a worse fit, or not much change, but it will be a fit that doesn't violate the assumptions. $\endgroup$
    – Peter Flom
    Commented Oct 19, 2012 at 21:22
  • $\begingroup$ a nonlinear transformation will make a linear relationship nonlinear (though sometimes you can transform x as well and fix that). However, transformation may also straighten up a curved one, and at the same time reduce the heteroskedasticity (though it's not always possible to do both with the same transformation). For that data a log-transform helps somewhat. $\endgroup$
    – Glen_b
    Commented Oct 20, 2012 at 1:09
  • 4
    $\begingroup$ Using the two extreme and middle (fifth) values of $y$, the method shown at stats.stackexchange.com/questions/35711/… indicates a logarithm (Box-Cox transformation with parameter 0) would be appropriate for linearizing the relationship. Using the first, sixth, and last values indicates the reciprocal (parameter -1) would be good. This suggests almost any parameter between 0 and -1 might work. The range is no surprise given how few data there are. No monotonic re-expression will stabilize the variation for these data. $\endgroup$
    – whuber
    Commented Oct 20, 2012 at 18:07

3 Answers 3

7
$\begingroup$

The MASS package that comes with your R installed already, has the boxcox() function that you can use: After reading in the data, do:

    library(MASS)
    boxcox(y ~ x)

Then look at the graph this produces, which shows graphically a 95% confidence interval for the boxcox transformation parameter. But you do not really have enough data (n=10) to do this, the resulting confidence interval goes almost from -2 to 2!, with a maximum likelihood estimate of approximately 0 (a log-transform, as said before). If your real data have more observations, you should try this.

As others have said, this transformation is really trying to stabilize variances. This is not really obvious from theory, what it does, is to try to maximize a normal-distribution based likelihood function, which assumes constant variance. One could think that maximizing a normal-based likelihood would try to normalize the distribution of the residuals, but in practice the main contribution to maximizing the likelihood comes from stabilizing the variances. This is maybe not so surprising, given that the likelihood we maximizes is based on a constant variance normal distribution family!

I once wrote a slider-based demo in XLispStat, which demonstrated this clearly!

$\endgroup$
3
$\begingroup$

When you have a linear relationship, but unequal variances then you generally need to transform both x and y to get a linear relationship with equal variances (or just use weighted least squares regression on the untransformed variables).

The AVAS procedure can be used to suggest possible transformations.

$\endgroup$
5
  • $\begingroup$ Take a look at the data: $y$ trends monotonically for $x$ from $1$ to $5$, then systematically oscillates a lot for $x$ between $5$ and $10$. This implies that no continuous monotonic re-expression of $y$ will succeed in stabilizing the variances. Your suggestion of weighted least squares looks promising in light of this limitation, but how should one choose the weights? $\endgroup$
    – whuber
    Commented Oct 20, 2012 at 18:10
  • $\begingroup$ Agree with @whuber $\endgroup$
    – broccoli
    Commented Oct 25, 2012 at 16:14
  • 1
    $\begingroup$ I agree with @whuber for this specific dataset, I just assumed that this data was quickly made up to illustrate (and therefore shows human lack of randomness/reality). My response is more the general advice for the general case of unequal variances. $\endgroup$
    – Greg Snow
    Commented Oct 25, 2012 at 17:12
  • $\begingroup$ Given that the variance increases with x, would a glm framework with a Poisson link function cut it? $\endgroup$ Commented Nov 19, 2012 at 11:05
  • 3
    $\begingroup$ @RomanLuštrik, a Poisson regression is something to consider, but the choice should be made based on the science, not the data. The above data has non-integers for $y$, so there would need to be some type of weight or observation window for the non-integers to make sense in a Poisson regression. It should only be considered if the response variable represents counts and the science behind the data is consistent with the Poisson distribution. $\endgroup$
    – Greg Snow
    Commented Nov 19, 2012 at 15:55
1
$\begingroup$

Well, in R you could try this:

library(MASS)
boxcox(y~x)
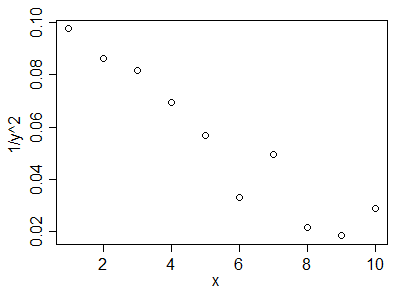
plot(1/y^2~x) # since the profile likelihood has a maximum near 2

enter image description here

But it really depends on what you mean by 'better fit to the data'

$\endgroup$

Your Answer

By clicking “Post Your Answer”, you agree to our terms of service and acknowledge you have read our privacy policy.

Not the answer you're looking for? Browse other questions tagged or ask your own question.