This is an interesting question. I wanted to contribute an answer which shows how we can do this practically in Python, and call out a few interesting things. I hope the interested reader will take the code, modify it and experiment themselves. I give a few suggestions for things to play around with at the end.
Python Implementation - using Pytorch
The code below creates a neural network using Pytorch. I have used the ReLU function between layers (see comment below).
I have tried to find a balance between a network which is simple and easy to train, but which also does a reasonable job (at least on the interval [0,10], see comments and graph below).
The model is trained on random data from the range [0,10].
Graphs
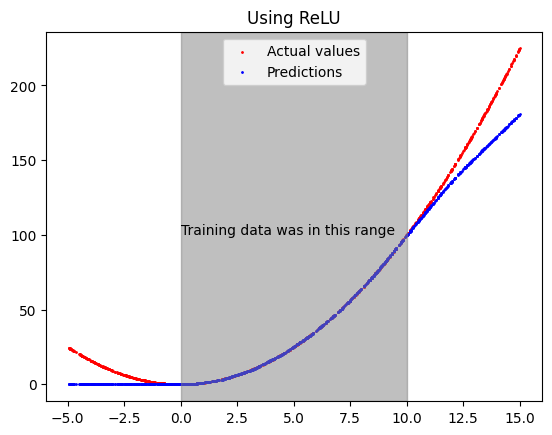
This graph shows the predicted (blue) and actual (red) values, for unseen random input data from the range [0,10].

- It is interesting to note how poorly the model performs outside the region on which it is trained.
Things to experiment with
- Try other activation functions or combinations (like
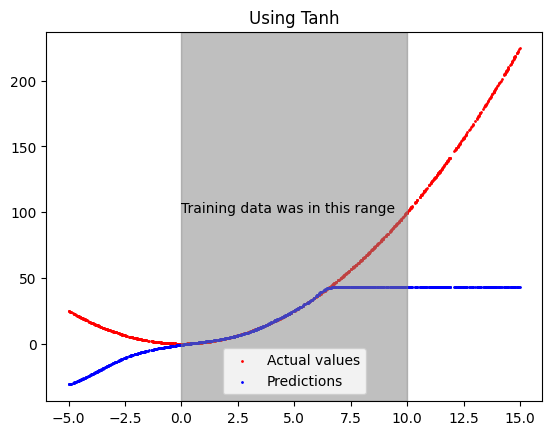
tanh). If I keep everything in the code below identical but change the activation functions to tanh we get.

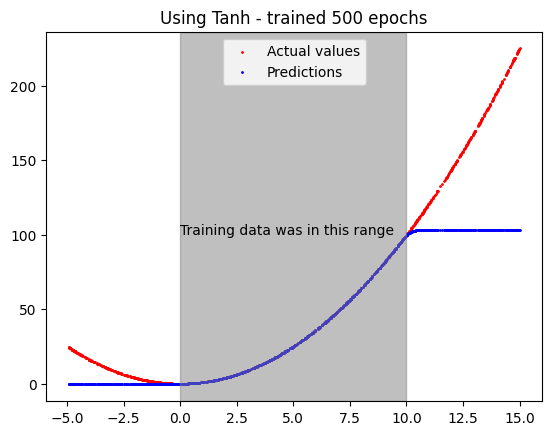
We can improve the performance with more epochs...

I also note here that the function $x^2$ is non-linear, so you could use that as your activation function - but I do not think that is in the spirit of this question :D
- See what happens if you use less training data or over a bigger range.
- See what happens if you change the architecture, for example using fewer layers.
Code
import torch
import torch.nn as nn
import torch.optim as optim
import matplotlib.pyplot as plt
# Create training data
X = torch.distributions.uniform.Uniform(0,10).sample([1000,1])
y = X**2
model = nn.Sequential(
    nn.Linear(1, 16),
    nn.ReLU(),
    nn.Linear(16, 16),
    nn.ReLU(),
    nn.Linear(16, 1),
)
loss_fn   = nn.MSELoss()
optimizer = optim.Adam(model.parameters(), lr=0.001)
n_epochs = 150
batch_size = 50

for epoch in range(n_epochs):
    for i in range(0, len(X), batch_size):
        Xbatch = X[i:i+batch_size]
        y_pred = model(Xbatch)
        ybatch = y[i:i+batch_size]
        loss = loss_fn(y_pred, ybatch)
        optimizer.zero_grad()
        loss.backward()
        optimizer.step()
    print(f'Finished epoch {epoch}, latest loss {loss}')

#Example, can we square 3 - looks ok
print(model(torch.tensor([3], dtype=torch.float)))

# For all intents and purposes we can assume the data below is all unseen - potentially could be some overlap by random chance with training X
unseenX = torch.distributions.uniform.Uniform(-5,15).sample([1000,1])

predictions_on_unseenX = model(unseenX)

# Plotting
fig, ax = plt.subplots()
plt.scatter(unseenX, unseenX**2, c="red", label="Actual values", s=1)
plt.scatter(unseenX, predictions_on_unseenX.detach(), c="blue", s=1, label="Predictions")
plt.text(0, 100, "Training data was in this range")
plt.title("Using ReLU ")
plt.legend()
ax.axvspan(0, 10, alpha=0.5, color='grey')
Further Reading
Interesting post on why ReLU works with the top answer focussing on this specific problem.
Similar post to this one on stack exchange.


