For a project, I wish to draw from multivariate skew normal copulas. Initially I thought my approach was correct, but now I believe it's highly unlikely that it's correct.
I've read up about the potential cause of my problem, but am still not too sure how to resolve it. Here was my initial code for the bivariate copula samples:
library(sn)
sampskew2d <- function(n, rho, a)
    {       samp <- rmsn(n, xi=c(0,0), Omega=matrix(c(1,rho,rho,1),nrow=2), alpha=a)
            skewcopsamples <- as.data.frame(samp)
            skewcopsamples[,1] <- psn(skewcopsamples[,1] ,xi=0, omega=1, alpha=a[1])
            skewcopsamples[,2] <- psn(skewcopsamples[,2] ,xi=0, omega=1, alpha=a[2])
        skewcopsamples
}
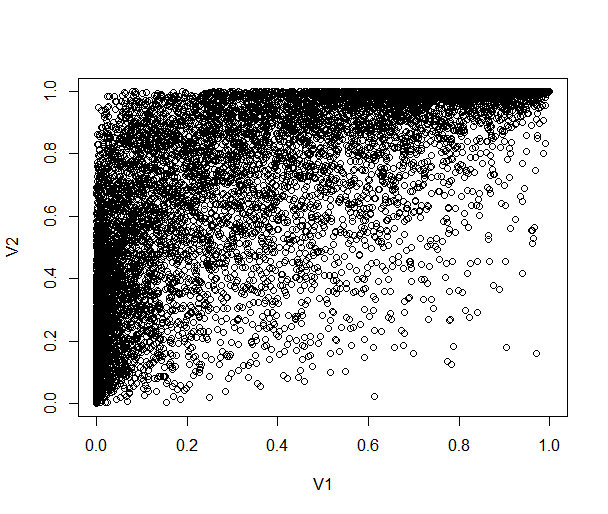
As initially I thought that I could just provide a correlation coefficient $\rho$, skewness parameters $\alpha_1,\alpha_2$ and then taking applying the marginal CDFs with respective skewness parameters $\alpha_1,\alpha_2$. An example for $\rho=0.7,\alpha_1=2,\alpha_2=-2$ gives the following plot:

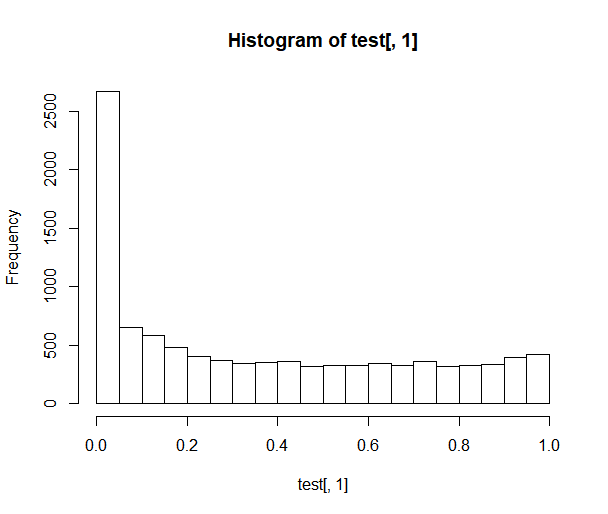
However, I realized since it's a copula, the marginals should be uniformly distributed in $(0,1)$, right? So I tried plotting the histograms of both marginals, and did not look uniform at all.

I read this might have to do with the implementation of the parametrisation, but am not sure how I should resolve this. Any help would be appreciated!

library()calls for the package(s) you use. $\endgroup$psn) that the marginal distribution of a multivariate skew normal distribution is again skew normal; but that seems not to be the case according to this paper. $\endgroup$