23
$\begingroup$

Recently, two different co-workers have used a kind of argument about differences between conditions that seems incorrect to me. Both of these co-workers use statistics, but they are not statisticians. I am a novice in statistics.

In both cases, I argued that, because there was no significant difference between two conditions in an experiment, it was incorrect to make a general claim about these groups with regard to the manipulation. Note that "making a general claim" means something like writing: "Group A used X more often than group B".

My co-workers retorted with: "even though there is no significant difference, the trend is still there" and "even though there is no significant difference, there is still a difference". To me, both of these sound like an equivocation, i.e., they changed the meaning of "difference" from: "a difference that is likely to be the result of something other than chance" (i.e., statistical significance), to "any non-zero difference in measurement between groups".

Was the response of my co-workers correct? I did not take it up with them because they outrank me.

$\endgroup$
1

6 Answers 6

37
$\begingroup$

This is a great question; the answer depends a lot on context.

In general I would say you are right: making an unqualified general claim like "group A used X more often than group B" is misleading. It would be better to say something like

in our experiment group A used X more often than group B, but we're very uncertain how this will play out in the general population

or

although group A used X 13% more often than group B in our experiment, our estimate of the difference in the general population is not clear: the plausible values range from group A using X 5% less often than group B to group A using X 21% more often than group B

or

group A used X 13% more often than group B, but the difference was not statistically significant (95% CI -5% to 21%; p=0.75)

On the other hand: your co-workers are right that in this particular experiment, group A used X more often than group B. However, people rarely care about the participants in a particular experiment; they want to know how your results will generalize to a larger population, and in this case the general answer is that you can't say with confidence whether a randomly selected group A will use X more or less often than a randomly selected group B.

If you needed to make a choice today about whether to use treatment A or treatment B to increase the usage of X, in the absence of any other information or differences in costs etc., then choosing A would be your best bet. But if you wanted be comfortable that you were probably making the right choice, you would need more information.

Note that you should not say "there is no difference between group A and group B in their usage of X", or "group A and group B use X the same amount". This is true neither of the participants in your experiment (where A used X 13% more) nor in the general population. In almost all real-world contexts, you know that there must really be some effect (no matter how slight) of A vs. B; you just don't know which direction it goes.

Finally, saying just

The difference between group A and B was not statistically significant (p=0.75)

is technically correct, but badly incomplete; without the estimate (13%) and the confidence intervals (-5% to 21%), your audience has no way of knowing whether how large or small the effect might be; contrary to what some people think, knowing that the $p$-value is large is not the same as knowing that the effect is small.

$\endgroup$
6
  • 7
    $\begingroup$ Beautiful response, Ben! I wonder if your second example statement could be modified for clarity to reflect the gist of the first example statement: "although group A used X 13% more often than group B IN OUR EXPERIMENT, the difference IN USAGE OF X BETWEEN GROUPS IN THE GENERAL POPULATION was not clear: the plausible range OF THAT DIFFERENCE went from A using X 5% less often than group B to A using X 21% more often than group B." $\endgroup$ Commented Jul 5, 2019 at 15:34
  • 3
    $\begingroup$ thanks, partially incorporated (trying to balance brevity/clarity and accuracy ...) $\endgroup$
    – Ben Bolker
    Commented Jul 5, 2019 at 23:00
  • 9
    $\begingroup$ +1 I think many people fail to realize that in the absence of statistical evidence, the observed differences may very well be the opposite of what’s going on with the population! $\endgroup$
    – Dave
    Commented Jul 5, 2019 at 23:51
  • $\begingroup$ @Dave: even if the presence of "statistical evidence" (statistically significant p-value?), "the observed differences may very well be the opposite of what’s going on with the population" $\endgroup$
    – boscovich
    Commented Jul 7, 2019 at 17:57
  • $\begingroup$ @boscovich Sure, I was talking in absolutes when we’re doing statistics, but I think of it as an insignificant p-value meaning that you really haven’t a clue what’s happening with the population. At least with a significant p-value you have reached some established threshold of evidence to suggest that you know something. But definitely it’s possible to get a significant p-value when it’s misidentified the direction. That error should happen from time to time. $\endgroup$
    – Dave
    Commented Jul 7, 2019 at 18:05
6
$\begingroup$

That's a tough question!

First things first, any threshold you may choose to determine statistical significance is arbitrary. The fact that most people use a $5\%$ $p$-value does not make it more correct than any other. So, in some sense, you should think of statistical significance as a "spectrum" rather than a black-or-white subject.

Let's assume we have a null hypothesis $H_0$ (for example, groups $A$ and $B$ show the same mean for variable $X$, or the population mean for variable $Y$ is below 5). You can think of the null hypothesis as the "no trend" hypothesis. We gather some data to check whether we can disprove $H_0$ (the null hypothesis is never "proved true"). With our sample, we make some statistics and eventually get a $p$-value. Put shortly, the $p$-value is the probability that pure chance would produce results equally (or more) extreme than those we got, assuming of course $H_0$ to be true (i.e., no trend).

If we get a "low" $p$-value, we say that chance rarely produces results as those, therefore we reject $H_0$ (there's statistically significant evidence that $H_0$ could be false). If we get a "high" $p$-value, then the results are more likely to be a result of luck, rather than actual trend. We don't say $H_0$ is true, but rather, that further studying should take place in order to reject it.

WARNING: A $p$-value of $23\%$ does not mean that there is a $23\%$ chance of there not being any trend, but rather, that chance generates results as those $23\%$ of the time, which sounds similar, but is a completely different thing. For example, if I claim something ridiculous, like "I can predict results of rolling dice an hour before they take place," we make an experiment to check the null hypothesis $H_0:=$"I cannot do such thing" and get a $0.5\%$ $p-$value, you would still have good reason not to believe me, despite the statistical significance.

So, with these ideas in mind, let's go back to your main question. Let's say we want to check if increasing the dose of drug $X$ has an effect on the likelihood of patients that survive a certain disease. We perform an experiment, fit a logistic regression model (taking into account many other variables) and check for significance on the coefficient associated with the "dose" variable (calling that coefficient $\beta$, we'd test a null hypothesis $H_0:$ $\beta=0$ or maybe, $\beta \leq 0$. In English, "the drug has no effect" or "the drug has either no or negative effect."

The results of the experiment throw a positive beta, but the test $\beta=0$ stays at 0.79. Can we say there is a trend? Well, that would really diminish the meaning of "trend". If we accept that kind of thing, basically half of all experiments we make would show "trends," even when testing for the most ridiculous things.

So, in conclusion, I think it is dishonest to claim that our drug makes any difference. What we should say, instead, is that our drug should not be put into production unless further testing is made. Indeed, my say would be that we should still be careful about the claims we make even when statistical significance is reached. Would you take that drug if chance had a $4\%$ of generating those results? This is why research replication and peer-reviewing is critical.

I hope this too-wordy explanation helps you sort your ideas. The summary is that you are absolutely right! We shouldn't fill our reports, whether it's for research, business, or whatever, with wild claims supported by little evidence. If you really think there is a trend, but you didn't reach statistical significance, then repeat the experiment with more data!

$\endgroup$
1
  • 2
    $\begingroup$ +1 for pointing out that any significance threshold is arbitrary (and by implication it is not possible to infer absolute claims about the general population from the results in a sample -- all you get are better probabilities). $\endgroup$ Commented Jul 7, 2019 at 10:19
5
$\begingroup$

Significant effect just means that you measured an unlikely anomaly (unlikely if the null hypothesis, absence of effect, would be true). And as a consequence it must be doubted with high probability (although this probability is not equal to the p-value and also depends on prior believes).

Depending on the quality of the experiment you could measure the same effect size, but it might not be an anomaly (not an unlikely result if the null hypothesis would be true).

When you observe an effect but it is not significant then indeed it (the effect) can still be there, but it is only not significant (the measurements do not indicate that the null hypothesis should be doubted/rejected with high probability). It means that you should improve your experiment, gather more data, to be more sure.

So instead of the dichotomy effect versus no-effect you should go for the following four categories:

four categories

Image from https://en.wikipedia.org/wiki/Equivalence_test explaining the two one sided t-tests procedure (TOST)

You seem to be in category D, the test is inconclusive. Your coworkers might be wrong to say that there is an effect. However, it is equally wrong to say that there is no effect!

$\endgroup$
4
  • $\begingroup$ "Significant effect just means that you measured the null hypothesis (absence of effect) must be doubted with high probability." I strongly disagree with this statement. What if I told you I can predict the result of any coin flip, we make an experiment, and out of pure luck we get a 1% $p$-value? Would you say there is a high probability of the null hypothesis being false? $\endgroup$
    – David
    Commented Jul 5, 2019 at 8:28
  • $\begingroup$ @David, I completely agree with you that the p-value is more precisely a measure for 'the probability that we make an error conditional that the null hypothesis is true' (or the probability to see such extreme results), and it does not express directly 'the probabilty that the null hypothesis is wrong'. However, I feel that the p-value is not meant to be to be used in this 'official' sense. The p-value is used to express doubt in the null hypothesis, to express that the results indicate an anomaly and anomalies should make us doubt the null.... $\endgroup$ Commented Jul 5, 2019 at 16:09
  • $\begingroup$ ....in your case, when you show to challenge the null effect (challenge the idea that one can not predict the coins) by providing a rare case (just like the tea tasting lady) then we should indeed have doubt in the null hypothesis. In practice we would need to set an appropriate p-value for this (since indeed one might challenge the null by mere chance), and I would not use the 1% level. The high probability to doubt the null should not be equated, one-to-one, with the p-value (since that probability is more a Bayesian concept). $\endgroup$ Commented Jul 5, 2019 at 16:16
  • $\begingroup$ I have adapted the text to take away this misinterpretation. $\endgroup$ Commented Jul 5, 2019 at 16:19
3
$\begingroup$

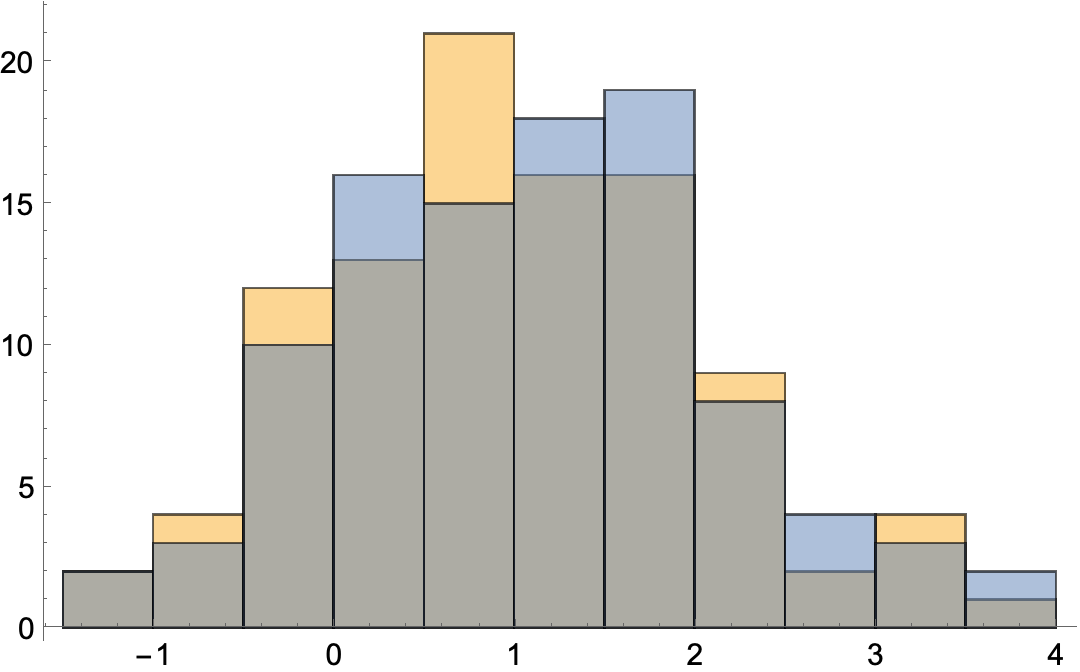
There is not enough information provided to establish the exact meaning of the word "trend." For example, two normal random variates were generated and seem to overlap as below. enter image description here Not knowing any better we do a two tailed t-test to see how they differ and get p = 0.495, not significant. Next, we examine if there is any trend or structure for the difference between them by using a pair-wise t-test and get p = 0.

This is because we didn't ask how the data were generated. Sample A consisted of 100 realizations of a random standard normal distribution. In this case, the pair-wise correlation between Sample A and Sample B is 1, and for each pair Sample B = Sample A + 0.1. That is, if the samples are not independent, and are correlated, we have to account for that in choosing our statistical testing.

Thus, I would ask what "trend" means by asking "What do you mean by trend?" In general, a "trend" can be very predictive, or not at all predictive depending on the circumstances. Moreover, we need to know what "two different conditions in an experiment" means. For example, these may or may not be random variates. They might for example be two different fit functions for a time series of blood plasma concentrations and we might be comparing two different methods of analyzing a single dataset. A very common mistake would be to look at the correlation between each model and the data, then compare the correlation coefficients as if they were uncorrelated. Comparison of correlated results yields a tendency, but without doing an analysis of correlated correlation coefficinets, which many people have never heard of, we would not be able to test properly for its significance.

In summary, there is not enough information provided about the experiment to render an opinion.

$\endgroup$
1
$\begingroup$

It sounds like they're arguing p-value vs. the definition of "Trend".

If you plot the data out on a run chart, you may see a trend... a run of plot points that show a trend going up or down over time.

But, when you do the statistics on it.. the p-value suggests it's not significant.

For the p-value to show little significance, but for them to see a trend / run in the series of data ... that would have to be a very slight trend.

So, if that was the case, I would fall back on the p-value.. IE: ok, yes, there's a trend / run in the data.. but it's so slight and insignificant that the statistics suggest it's not worth pursuing further analysis of.

An insignificant trend is something that may be attributable to some kind of bias in the research.. maybe something very minor.. something that may just be a one time occurence in the experiment that happened to create a slight trend.

If I was the manager of the group, I would tell them to stop wasting time and money digging into insignificant trends, and to look for more significant ones.

$\endgroup$
1
$\begingroup$

It sounds like in this case they have little justification for their claim and are just abusing statistics to reach the conclusion they already had. But there are times when it's ok to not be so strict with p-val cutoffs. This (how to use statistical significance and pval cutoffs) is a debate that has been raging since Fisher, Neyman, and Pearson first laid the foundations of statistical testing.

Let's say you are building a model and you are deciding what variables in include. You gather a little bit of data to do some preliminary investigation into potential variables. Now there's this one variable that the business team really is interested in, but your preliminary investigation shows that the variable is not statistically significant. However, the 'direction' of the variable comports to what the business team expected, and although it didn't meet the threshold for significance, it was close. Perhaps it was suspected to have positive correlation to the outcome and you got a beta coefficient that was positive but the pval was just a bit above the .05 cutoff.

In that case, you might go ahead and include it. It's sort of an informal bayesian statistics -- there was a strong prior belief that it is a useful variable and the initial investigation into it showed some evidence in that direction (but not statistically significant evidence!) so you give it the benefit of the doubt and keep it in the model. Perhaps with more data it will be more evident what relationship it has with the outcome of interest.

Another example might be where you are building a new model and you look at the variables that were used in the previous model -- you might continue to include a marginal variable (one that is on the cusp of significance) to maintain some continuity from model to model.

Basically, depending on what you are doing there are reasons to be more and less strict about these sorts of things.

On the other hand, it's also important to keep in mind that statistical significance does not have to imply a practical significance! Remember that at the heart of all this is sample size. Collect enough data and the standard error of the estimate will shrink to 0. This will make any sort of difference, no matter how small, 'statistically significant' even if that difference might not amount to anything in the real world. For example, suppose the probability of a particular coin landing on heads was .500000000000001. This means that theoretically you could design an experiment which concludes that the coin is not fair, but for all intents and purposes the coin could be treated as a fair coin.

$\endgroup$

Your Answer

By clicking “Post Your Answer”, you agree to our terms of service and acknowledge you have read our privacy policy.

Not the answer you're looking for? Browse other questions tagged or ask your own question.