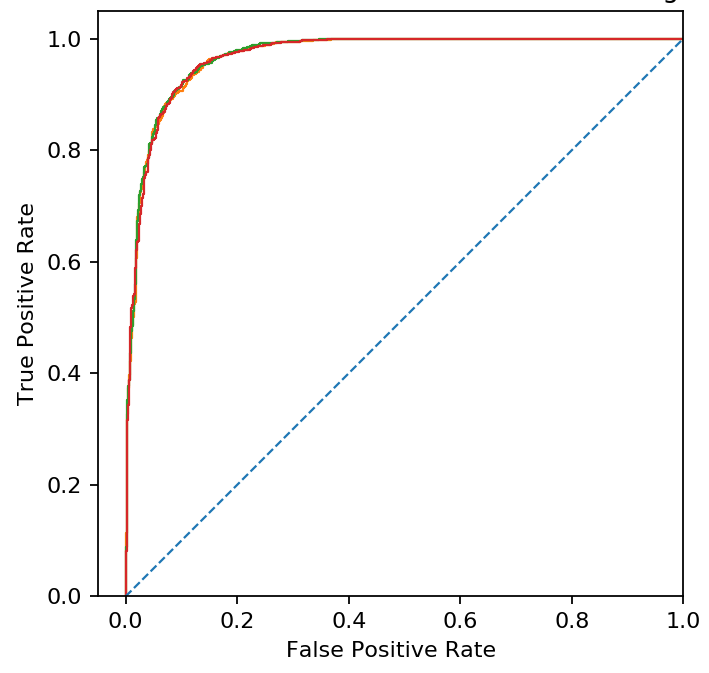
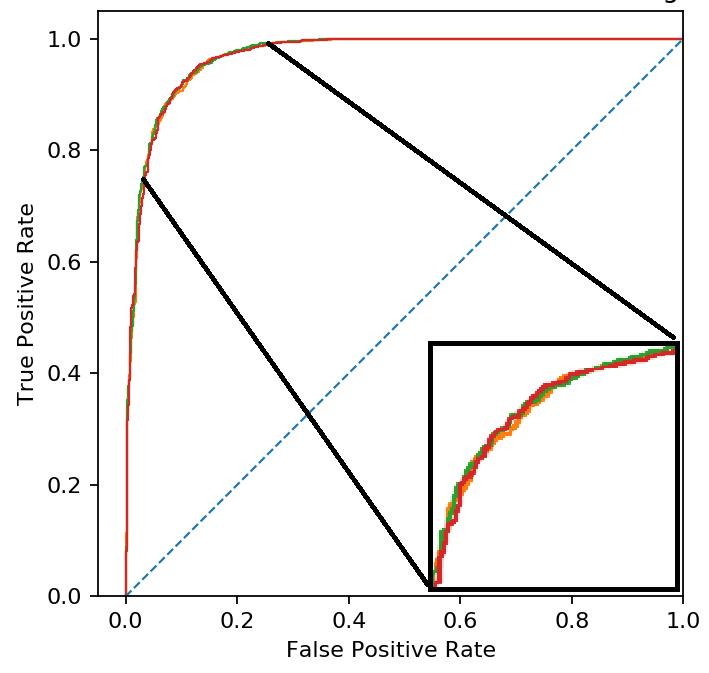
I have a model and the ROC curve it produces, I modified the model and it produced a second ROC curve that is very similar in shape to the first.
If I graph these ROC curves on the same plot, then it is difficult to tell the curves apart. Is there a way of plotting the difference curve 2 and 1, or another way to visualise this difference that is more clear?
Above is my plot in python, the original model is in orange, and the two improved models are green and red. It is difficult to see their minor differences.


