10
$\begingroup$

Consider an input matrix $X$ and a binary output $y$.

A common way to measure the performance of a classifier is to use ROC curves.

In a ROC plot the diagonal is the result that would be obtained from a random classifier. In case of an unbalanced output $y$ the performance of a random classifier can be improved choosing $0$ or $1$ with different probabilities.

How can the performance of such classifier be represented in a ROC curve plot? I suppose it should be a straight line with a different angle, and not the diagonal anymore?
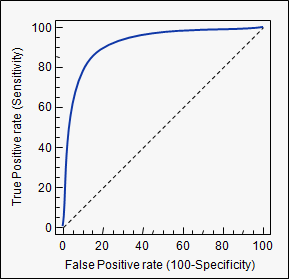
ROC curve example

$\endgroup$
1

1 Answer 1

17
$\begingroup$

ROC curves are insensitive to class balance. The straight line you obtain for a random classifier now is already the result of using different probabilities of yielding positive (0 brings you to (0, 0) and 1 brings you to (1, 1) with any range inbetween).

Nothing changes in an imbalanced setting.

$\endgroup$
1
  • 1
    $\begingroup$ I find it helpful to consider the meaning of the area under curve to see why the diagonal does not change. AUC can be interpreted as the probability that a randomly selected positive example will have a higher score than a randomly selected negative example.1. This makes it clearer to me why class imbalance is not an issue. $\endgroup$
    – JBecker
    Commented Jan 7, 2015 at 22:01

Your Answer

By clicking “Post Your Answer”, you agree to our terms of service and acknowledge you have read our privacy policy.

Not the answer you're looking for? Browse other questions tagged or ask your own question.