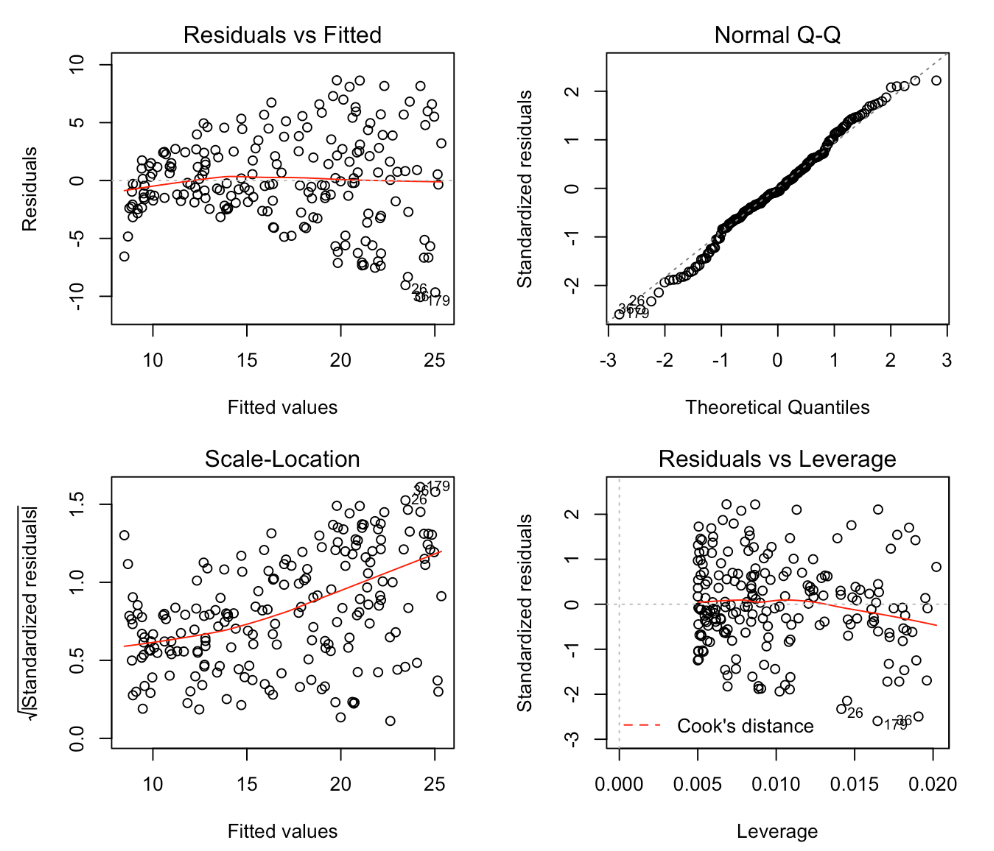
The plot function in R provides four diagnostic plots for linear regression:
It seems like the residuals vs fitted plot and the scale-location plot are basically providing the same exact information. So why provide this seemingly redundant information? What is the scale-location plot adding?

