2
$\begingroup$

I have some experimental data, where due to the nature of the experiment (which I am not familiar with) the errors are not known. The data follow a rough non-linear trend but clearly are noisy as for similar x-values, there are data points with different y-values. Unfortunately I also only have a handful of data points.

  1. Is it possible to get estimates on errors for the data points without knowing their functional form? E.g. from how different y-values are for data points with similar x-values? For each x-value, however, there is only one data point. There may also be errors in both the x and y values... Are any kind of resampling methods that could help?

Then I have a theoretical model (developed independently to the data), which is nonlinear and with a number of free parameters (too many... but it is difficult to narrow them down).

In a perfect world, I would have many more data points with known errors, and a convincing fit with reasonable parameter values would support my theoretical arguments, or a terrible fit would at least tell me I have no idea what is going on. Right now I have trouble deciding the difference between a convincing fit and a terrible fit.

  1. How do I know if I am overfitting?
  2. Is it possible in this case to deduce something about the goodness of fit? Or is it hopeless and I need to wait until better data becomes available?

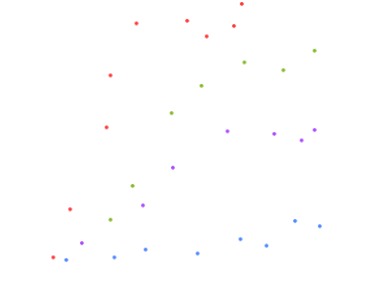
What the data looks like:

enter image description here

The colors correspond to a second independent variable (which was determined very precisely), which does not introduce any additional parameters. I.e. my model would fit to all four lines at once.

$\endgroup$
3
  • $\begingroup$ Would you please post the data or a scatterplot? $\endgroup$ Commented Aug 28, 2019 at 16:28
  • $\begingroup$ @JamesPhillips, updated. The data are not mine, so I left out actual values. $\endgroup$
    – The Hagen
    Commented Aug 28, 2019 at 18:30
  • 1
    $\begingroup$ "the nature of the experiment (which I am not familiar with)" No-one should attempt to analyse data from an experimental setup that they do not know about! Ask the experimenters to provide information rather than asking statisticians to help with workarounds. $\endgroup$ Commented Aug 3 at 7:26

1 Answer 1

0
$\begingroup$

A linear regression with one hot encoding for the second independent variable might do the trick.

I could post python code if that would be helpful.

$\endgroup$
3
  • $\begingroup$ Thank you for your answer, but I'm not sure I understand. Is the linear regression for estimating error? The thing is, based on theory, it is unlikely that the data follow a linear relationship (could be something like an inverted exponential), so I would prefer to not assume linearity because that is probably incorrect. $\endgroup$
    – The Hagen
    Commented Aug 28, 2019 at 20:38
  • $\begingroup$ Just looking at the provided picture gives me this impression. In general for such simple datasets with this amount of data a human should see the best fitting pattern with his eye. No machine learning algorithm will do much better. $\endgroup$ Commented Aug 28, 2019 at 21:00
  • $\begingroup$ Of course an exception is the availability of theoretical knowledge which allows you to further describe the model. However, you have only limited data so all parameters of your model must be fitted with the data or available theoretical knowledge. Especially because you have so few data almost all assumptions that you will make even based on theoretical knowledge can very likely become overfitting. $\endgroup$ Commented Aug 28, 2019 at 21:00

Your Answer

By clicking “Post Your Answer”, you agree to our terms of service and acknowledge you have read our privacy policy.

Not the answer you're looking for? Browse other questions tagged or ask your own question.