0
$\begingroup$

I am new to NN. I am trying to train a network where the loss is defined by the Covariance between the first 10 samples and the last 10 samples. I am able to achieve a working model, but this is how the loss function through 500 epochs looks like loss function plot
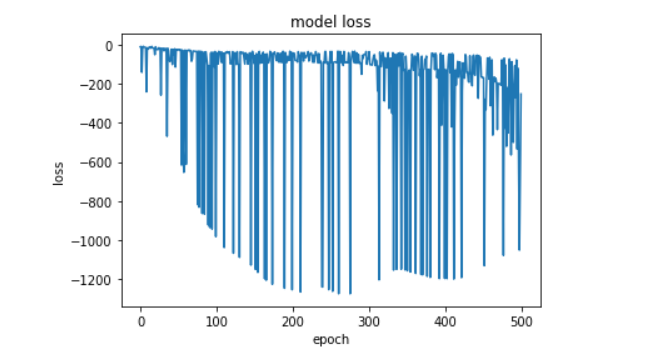
As can be seen, it looks like the loss gradually decreases until it reaches a minimum and then increases again. How should I interpret this result?

$\endgroup$
2
  • $\begingroup$ it looks like you need to give more information w.r.t the data and the code. This behavior is normal with neural networks if the learning rate is high and forces the model to oscillate between good and bad $\endgroup$ Commented Sep 6, 2019 at 16:12
  • 1
    $\begingroup$ You might want to take a look at stats.stackexchange.com/questions/201129/… as well $\endgroup$ Commented Sep 6, 2019 at 16:12

0

Your Answer

By clicking “Post Your Answer”, you agree to our terms of service and acknowledge you have read our privacy policy.

Browse other questions tagged or ask your own question.