I have data which is independent, but non-normal, with unequal variance. There are more than two groups, all with the same sample size. Which non-parametric test can I use?
-
2$\begingroup$ You should not be using characteristics you identify in the sample you're testing to choose which test you use, since it impacts the properties of the test (e.g. p-values won't be uniform under the null). What are the characteristics of your variables? Why would normality be the only parametric distributional model considered? Are you interested in shift alternatives or more general ones? Is the situation one in which the population distributions would plausibly be the same when the null were true? (e.g one in which a 'no treatment effect' would imply no effect on the distribution at all) $\endgroup$– Glen_bCommented Sep 16, 2019 at 1:01
-
$\begingroup$ Note that it's not a requirement that the samples in a Mann-Whitney test have equal spread (in spite of numerous sources that say otherwise, sadly). It's not about what you see in the data but about what you're prepared to assume under the null. The test can be perfectly valid when that's not true in the data. You need exchangeability under the null, not under the alternative, and there are plenty of reasonable classes of alternative for the Mann-Whitney that are not location-shift alternatives. $\endgroup$– Glen_bCommented Sep 23, 2019 at 4:49
2 Answers
Comment:
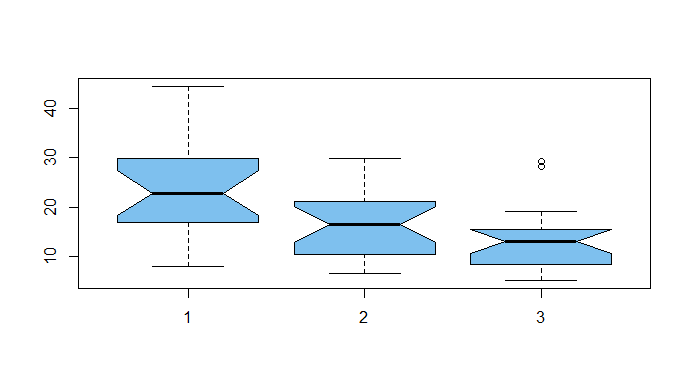
Simulated gamma data Here are simulated gamma data to illustrate some of the points in BenBolker's Answer (+1). Although none of the traditional tests is completely satisfactory, the Kruskal-Wallis test shows differences in groups for my fake data (in which one difference between groups is rather large).
set.seed(123)
x1 = round(rgamma(20, 5, .2), 3)
x2 = round(rgamma(20, 5, .25), 3)
x3 = round(rgamma(20, 5, .35), 3)
sd(x1); sd(x2); sd(x3)
[1] 10.30572
[1] 6.218724
[1] 6.483086
Sample standard deviations differ, and box plots show different dispersions along with different locations.
x = c(x1, x2, x3)
g = as.factor(rep(1:3, each=20))
boxplot(x ~ g, notch=T, col="skyblue2")
Notches in the sides of the boxes are nonparametric confidence intervals calibrated so that, comparing two groups, CIs that overlap suggest no significant difference. So the first and last groups may differ significantly.
Kruskal-Wallis test, with ad hoc Wilcoxon comparisons. A Kruskal-Wallis test detects differences among the three groups.
kruskal.test(x ~ g)

        Kruskal-Wallis rank sum test

data:  x by g
Kruskal-Wallis chi-squared = 13.269,
 df = 2, p-value = 0.001314
Ad hoc tests with two-sample Wilcoxon tests show significant differences between groups 1 and 3. P-values for the other two comparisons are not small enough to satisfy the Bonferroni criterion against false discovery.
wilcox.test(x1,x2)$p.val
[1] 0.01674239
wilcox.test(x2,x3)$p.val
[1] 0.06343245
wilcox.test(x1,x3)$p.val
[1] 0.000667562
Welch one-factor ANOVA with ad hoc Welch t comparisons. Here we have moderately large samples and only moderate skewness. A Welch one-way ANOVA, which does not assume equal variances may be useful. The overall test gives a highly significant result; you could use Welch two-sample t tests for ad hoc comparisons.
oneway.test(x ~ g)

      One-way analysis of means
   (not assuming equal variances)

data:  x and g
F = 6.905, num df = 2.000, denom df = 36.733,
  p-value = 0.002847
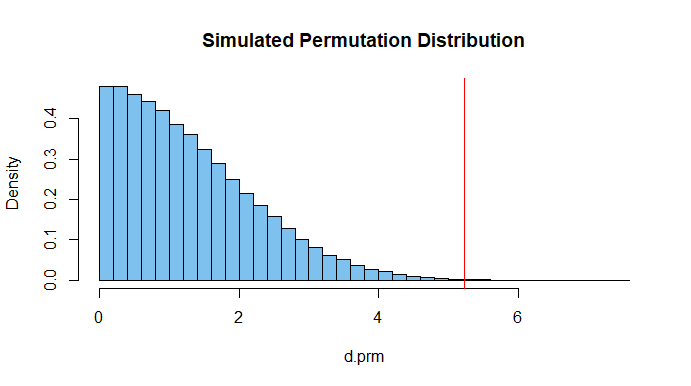
Permutation test focused on differences among group means. Finally, a permutation test with the standard deviation of the three (permuted) group means as 'metric', shows a significant difference. This metric focuses on differences among group means. The test is nonparametric. The P-value 0.0008 is similar to that of the Kruskal-Wallis test.
d.obs = sd(c(mean(x1),mean(x2),mean(x3)))
set.seed(915)
m = 10^5;  d.prm = numeric(m)
for(i in 1:m) {
  x.prm = sample(x) # scrambe obs among gps
  a1=mean(x.prm[1:20]); a2=mean(x.prm[21:40]); a3=mean(x.prm[41:60])
  d.prm[i] = sd(c(a1,a1,a3)) }
mean(d.prm >= d.obs)
[1] 0.00075
length(unique(d.prm))
[1] 77417
Of the 100,000 iterations there were over 77,000
uniquely different values of d.prm. Their histogram
is shown below along with the value 5.235 of d.obs.
-
$\begingroup$ Standard deviation (or variance) of the means is super clever! Do you have any references that explore this more? My first thought when I saw this question was to permute the group labels, but I was at a loss for what the test statistic would be with more than two groups (can’t take the difference between two means). $\endgroup$– DaveCommented Sep 16, 2019 at 2:25
-
$\begingroup$ That may be a left-over idea of Bill Kruskal's from back in the 1960's. Good references for permutations tests seem scarce. I co-authored a fairly elementary paper on permutations tests pub in ASA's J. or Statistics Educ. several years back. L. Eudey was first author. // Also, there are some interesting pages on this site. Dinner time now, but I'll google around later and report any successes. $\endgroup$– BruceETCommented Sep 16, 2019 at 3:07
-
$\begingroup$ @Dave: Online searches using 'permutation test' yielded some worthwhile papers, including some that referenced the Eudey paper. But overall what I saw is wide, not deep. $\endgroup$– BruceETCommented Sep 16, 2019 at 9:40
The Kruskal-Wallis test is a rank-based analogue of 1-way ANOVA, so it would be a reasonable approach to nonparametric testing of differences in location for >=2 groups.
HOWEVER: the "unequal variance" thing really messes you up. This answer discusses why unequal variances are problematic for Mann-Whitney tests (the 2-sample version of K-W/non-parametric version of the t-test), and the same problem applies to K-W, as discussed on Wikipedia (linked above):
If the researcher can make the assumptions of an identically shaped and scaled distribution for all groups, except for any difference in medians, then the null hypothesis is that the medians of all groups are equal, and the alternative hypothesis is that at least one population median of one group is different from the population median of at least one other group.
Loosely speaking, from my answer to the Mann-Whitney question:
If you are satisfied with showing that the distribution of the groups differs in some way from that of men, then you don't need the extra assumption [of equality of distribution except for location].
-
$\begingroup$ Thanks for your answer. Now let's say that I have the same population non normal and unequal variance with more than 2 groups and independant. If I pick two groups (there are 12 in total), 1 of them is a control sample and I want to test if the mean is different from the control group. Would be suitable to do a two sample test? Such as mann whitney? Btw my data is continuous $\endgroup$– IvanCommented Sep 15, 2019 at 23:04
-
$\begingroup$ See my linked answer. Mann-Whitney would be OK for two groups, but: It's very hard to test differences in location (mean, median, etc.) non-parametrically if you're not willing to assume that the distributions in each group are identical up to a shift (change in location). $\endgroup$ Commented Sep 15, 2019 at 23:47


