I have two i.i.d. binomial variables $X$ and $Y$ with given $n$ and $p.$ What is probability mass function of $Z = X \times Y$? I need pmf as function $f(Z, n, p).$
-
1$\begingroup$ It's going to be messy to express, because the values with positive probability are all the possible products of two integers in the set $\{0,1,\ldots, n\},$ which contains a complex pattern of gaps. Could you therefore specify the form in which you need this pmf or what you hope to use it for? $\endgroup$– whuber ♦Commented Sep 18, 2019 at 21:26
-
$\begingroup$ @whuber I've fixed my question. $\endgroup$– user2579566Commented Sep 18, 2019 at 21:34
1 Answer
There are various ways you could write the mass function of this distribution. All of them will be messy, since they involve checking the possible products that give a stipulated value for the product variable. Here is the most obvious way to write the distribution.
Let $X, Y \sim \text{IID Bin}(n, p)$ and let $Z=XY$ be their product. For any integer $0 \leqslant z \leqslant n^2$ we define the set of pairs of values:
$$\mathcal{S}(z) \equiv \{ (x,y) \in \mathbb{N}_{0+}^2 \mid \max(x,y) \leqslant n, xy=z \}.$$
This is the set of all pairs of values within the support of the binomial that multiply to the value $z$. (Note that it will be an empty set for some values of $z$.) We then have:
$$\begin{equation} \begin{aligned} p_Z(z) \equiv \mathbb{P}(Z=z) &= \mathbb{P}(XY=z) \\[6pt] &= \sum_{(x,y) \in \mathcal{S}(z)} \text{Bin}(x\mid n,p) \cdot \text{Bin}(y\mid n, p) \\[6pt] &= \sum_{(x,y) \in \mathcal{S}(z)} {n \choose x} {n \choose y} \cdot p^{x+y} (1-p)^{2n-x-y}. \end{aligned} \end{equation}$$
Computing this probability mass function requires you to find the set $\mathcal{S}(z)$ for each $z$ in your support. The distribution has mean and variance:
$$\mathbb{E}(Z) = (np)^2 \quad \quad \quad \quad \quad \mathbb{V}(Z) = (np)^2 [(1-p+np)^2 - (np)^2].$$
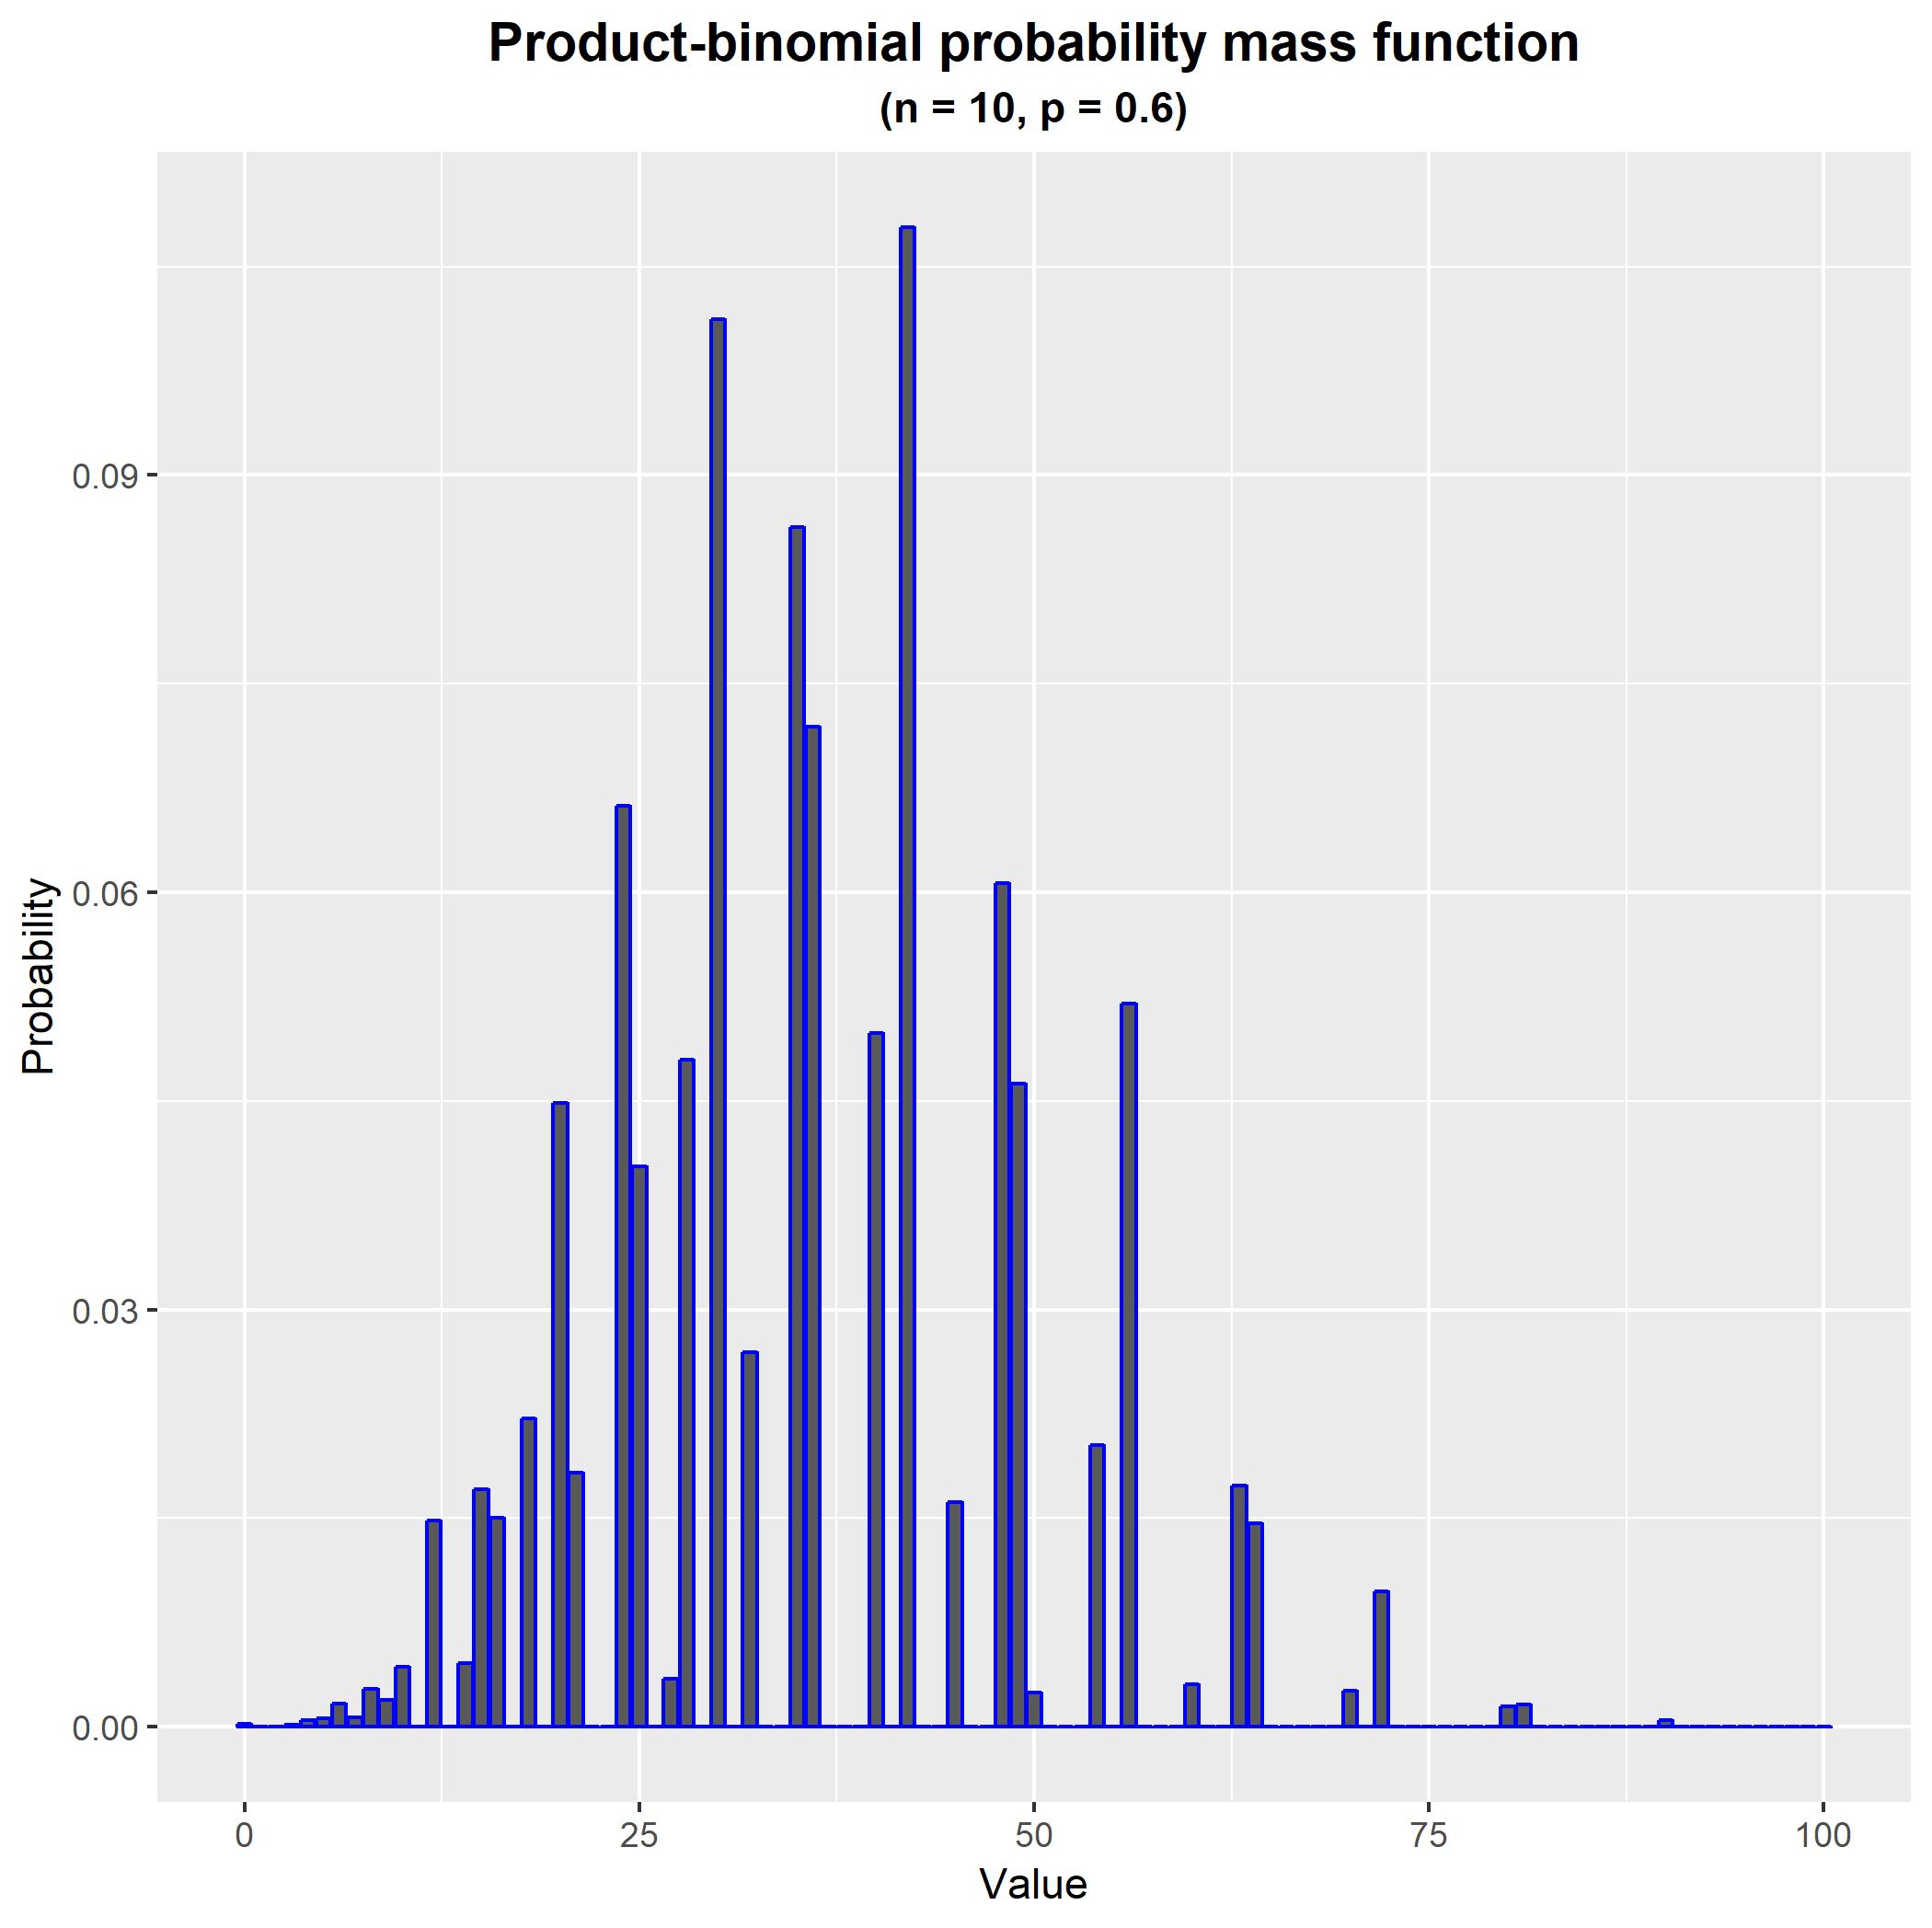
The distribution will be quite jagged, owing to the fact that it is the distribution of a product of discrete random variables. Notwithstanding its jagged distribution, as $n \rightarrow \infty$ you will have convergence in probability to $Z/n^2 \rightarrow p^2$.
Implementation in R: The easiest way to code this mass function is to first create a matrix of joint probabilities for the underlying random variables $X$ and $Y$, and then allocate each of these probabilities to the appropriate resulting product value. In the code below I will create a function dprodbinom which is a vectorised function for the probability mass function of this "product-binomial" distribution.
#Create function for PMF of the product-binomial distribution
dprodbinom <- function(Z, size, prob, log = FALSE) {

  #Check input vector is numeric
  if (!is.numeric(Z))     { stop('Error: Input values are not numeric'); }

  #Set parameters
  n <- size;
  p <- prob;

  #Generate matrix of joint probabilities
  SS <- matrix(-Inf, nrow = n+1, ncol = n+1);
  XX <- dbinom(0:n, size = n, prob = p, log = TRUE);
  for (x in 0:n) {
  for (y in 0:n) {
    SS[x+1, y+1] <- XX[x+1] + XX[y+1]; } }

  #Compute the log-mass function of the product random variable
  LOGPMF <- rep(-Inf, n^2+1);
  for (x in 0:n) {
  for (y in 0:n) {
    LOGPMF[x*y+1] <- matrixStats::logSumExp(c(LOGPMF[x*y+1], SS[x+1, y+1])); } }

  #Generate the output vector
  OUT <- rep(-Inf, length(Z));
  for (i in 1:length(Z)) {
    if (Z[i] %in% 0:(n^2)) {
      OUT[i] <- LOGPMF[Z[i]+1]; } }

  #Give the output of the function
  if (log) { OUT } else { exp(OUT) } }
We can now easily generate and plot the probability mass function of this distribution. For example, with $n=10$ and $p = 0.6$ we obtain the following probability mass function. As you can see, it is quite jagged, owing to the fact that the product values are distributed in a lagged pattern over the joint values of the underlying random variables.
#Load required libraries
library(matrixStats);
library(ggplot2);

#Generate the mass function
n <- 10;
p <- 0.6;
PMF <- dprodbinom(0:100, size = n, prob = p, log = FALSE);

#Plot the mass function
THEME  <- theme(plot.title = element_text(hjust = 0.5, size = 14, face = 'bold'),
                plot.subtitle = element_text(hjust = 0.5, face = 'bold'));
DATA   <- data.frame(Value = 0:100, Probability = PMF);
FIGURE <- ggplot(aes(x = Value, y = Probability), data = DATA) +
            geom_bar(stat = 'identity', colour = 'blue') +
            THEME +
            ggtitle('Product-binomial probability mass function') +
            labs(subtitle = paste0('(n = ', n, ', p = ', p, ')'));
FIGURE;
-
$\begingroup$ I think you might find it easier and more insightful to express the result in terms of the prime factorization of $z.$ BTW, the $\max(x,y)\le n$ condition is superfluous. $\endgroup$– whuber ♦Commented Sep 18, 2019 at 21:55
-

