I'm attemtping to fit a binomial glmm to my data. I've been using lme4 and I'm somewhat confused about interpretting the results. I think you'll be able to answer my question pretty quickly, so hopefully it won't take too much of your time.
I have an instrument which can measure the movement of flying objects such as birds and drones. I'm attempting to model the success of the instrument (whether it obtains a fix or not, so binary response) as a function of movement characteristics of the target (a drone, in this case) and the operating environment.
The model looks like this: fit <- glmer(SUCCESS~clutter+I(Range/1000)+GPSSpeed+TANGLE+(1|TestFlightID),data=subset(FLYdata,(TestFlightID %in% clutdet) & (SUCCESS==0 | SUCCESS==1)),family=binomial(link = "logit")).
Clutter is a binary variable that denotes whether a particular fix was inside or outside a clutter area (areas with various background features that could provide a non-target source of reflectance, causing the instrument to record a false-positive detection). TANGLE is a continuous variable describing turning angle and GPSSpeed is what you might expect.
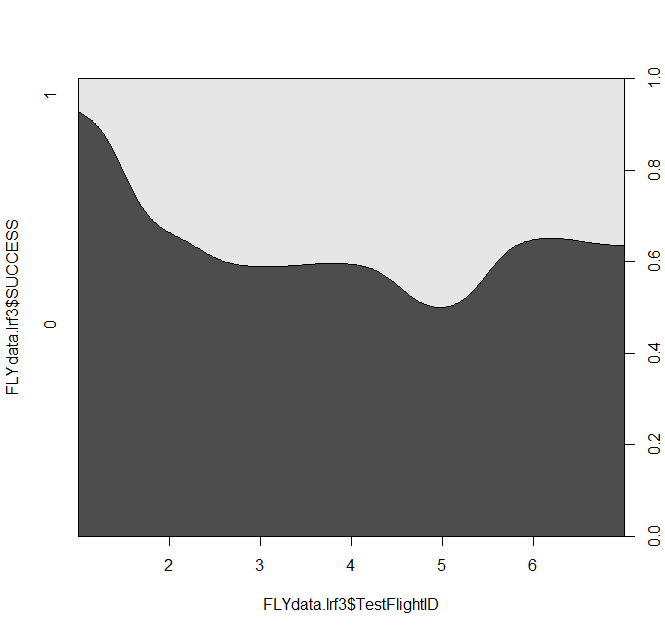
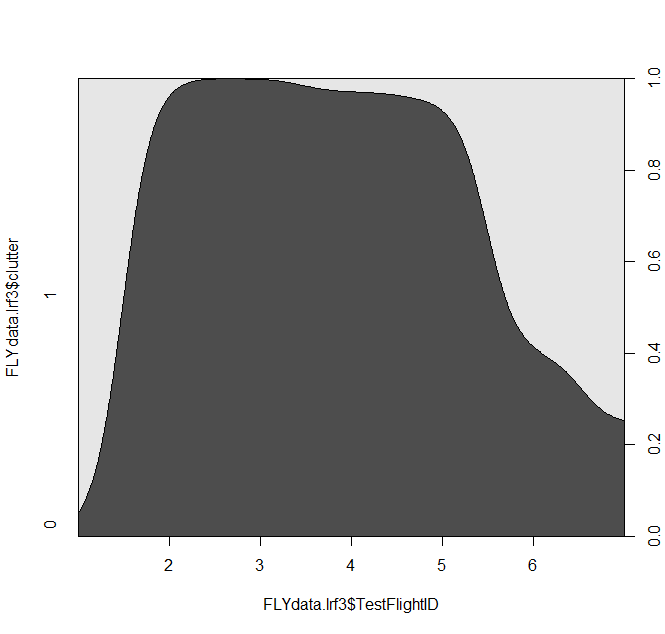
Given the data I’m expecting to see a reduction in success inside clutter areas (sorry I’m not sure how to graph binary data against each other….but see attached graphs for attempt):
             SUCCESS
clutter       0   1
       0     387 254
       1     208  81
As you may have noticed from the plots some of the test flights are completely inside or outside clutter areas:
                   TestFlightID
   clutter          2   3   4   5   6   7   8
     0              0  92 155 167 130  62  35
     1              86   0   0   5   6  92 100
and this may be influencing success rate:
                   TestFlightID
      Success    2   3   4   5   6    7    8
         0      82  65  92  103  66  101   86
         1       4  27  63   69  70   53   49
But when I run the model I get a positive z value for clutter (z=0.26582, p>0.05). The fact that it’s not significant is fine but given the data I was surprised by the positive slope when clutter is 1 (i.e. inside clutter areas) and I’m wondering if it’s perhaps due to the larger sample size of unsuccessful data overall and the greater proportion of data outside clutter areas in the data and also the imbalance in success/clutter across the random effect of tests flights:
               SUCCESS
               0   1
              595 335


              clutter
               0   1
              641 289
I’m wondering if I need to weight the data in some way to account for the imbalance in the response (SUCCESS) and the one of the fixed effects (CLUTTER) across the levels of the random effect (TestflightID)? i.e. the fact that although success appears to decrease inside clutter areas (from the crude graphs) the model estimates a positive relationship with success inside clutter. GLMMs are on the edge of know how, I'm unsure if weighting is the approproiate way to account for such an imbalance? Is such an imbalance even a problem? And if so, how could weights help? Or any other advice you might have would be very welcome.
Many Thanks!


