7
$\begingroup$

I will be grateful for some advice regarding using two highly correlated independent variables in a multivariate regression.

I would like to control for respondents' religion (Muslim, Christian, other) in addition to their country of origin. My problem is that one of the three countries in the sample is predominantly Muslim (over 90% of respondents in this country said they were Muslim). On the other hand, the share of Muslims in the remaining two countries is less than 5%. Consequently, one stands for another.

Question 1 - am I right in thinking that this leads to collinearity?

At the same time, post-estimation tests suggest strong preference for the model with religion and country of origin. Moreover, regressing outcome of interest on each religion as well as on country separately shows that each is highly significant. Importantly, they affect the independent variable in opposite directions - I would expect that coming from a predominantly Muslim country to have the same impact on the outcome of interest as being Muslim as both are tantamount to one another in my dataset, but that is not the case - and the reason I would like to keep both.

Question 2 - given the distribution of religion by country, is keeping both justifiable?

$\endgroup$
3
  • 2
    $\begingroup$ I've removed the term multivariate from the title as being irrelevant to the question and almost certainly incorrect. Multivariate regression concerns several outcome variables at once; it is not another term for multiple regression, having several predictor variables. Other way round, I think independent variable is here a slip for dependent variable, but I will let that stand. $\endgroup$
    – Nick Cox
    Commented Dec 20, 2023 at 13:06
  • 1
    $\begingroup$ OP may not be around to respond, but the thread remains, regardless. $\endgroup$
    – Nick Cox
    Commented Dec 20, 2023 at 13:07
  • 1
    $\begingroup$ That is, affect the independent variable should be affect the dependent variable. $\endgroup$
    – Nick Cox
    Commented Dec 20, 2023 at 14:13

3 Answers 3

5
$\begingroup$

You are correct: these data, as ordinarily encoded, are necessarily almost collinear.

To see this, consider the case of two religions (or, equivalently, a simplification in which Muslims are compared to non-Muslims). Use standard "dummy coding" for Muslimness and for country. This means there are six possible 4-vectors for encoding the $2\times 3$ possible combinations of characteristics:

$$\begin{array}[lc|cccc][ \text{Religion} & \text{Country} & x_1 & x_2 & x_3 & x_4\\ \hline \text{Non-Muslim} & \text{A} & 1 & 0 & 0 & 0\\ \text{Muslim} & \text{A} & 1 & 1 & 0 & 0\\ \text{Non-Muslim} & \text{B} & 1 & 0 & 1 & 0\\ \text{Muslim} & \text{B} & 1 & 1 & 1 & 0\\ \text{Non-Muslim} & \text{C} & 1 & 0 & 0 & 1\\ \text{Muslim} & \text{C} & 1 & 1 & 0 & 1 \end{array}$$

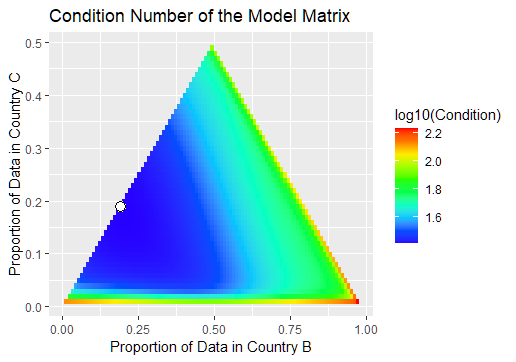
There is one constraint: the proportion of Muslim records within country A (say) must be 90+% while the proportions of Muslim records within each of the other two countries must be around 5%. What we are not told are the proportions of each country. That gives us two parameters to vary; say, proportions of countries B and C within the dataset. For each possible value of these parameters we may compute the condition number of the model matrix. (An algebraic formula would be very complicated, so numerical computation is advised.)

Here is a plot of that condition number. To show detail I have eliminated a strip of extremely large values along the upper right (where nearly all data are from country A). The white dot marks where the condition number is smallest.

enter image description here

The smallest possible value is attained when each of countries B and C constitute about 18.8% of the dataset (and therefore country A is the remaining 62.4%). But this condition number is still 25.81, indicating near-collinearity (the smallest eigenvalue of the model matrix is less than 1/25 = 4% of the largest).

This might not be a problem for your analysis. If you find strong effects and significant relationships, then collinearity has not caused a problem. So please, do not base your choice of models on the condition number: use this analysis only if bad conditioning actually becomes a problem.

$\endgroup$
1
  • $\begingroup$ would be also the r script disclosed? Thanks $\endgroup$
    – Maximilian
    Commented Dec 23, 2023 at 15:52
4
$\begingroup$

First, correlation, by itself, does not always lead to problematic collinearity (although when it is this strong, I'd say it's likely). One way to evaluate collinearity when one (or more) variables are categorical is to use the perturb package in R. What this does is randomly shift a small amount of data and see how that affects parameter estimates. (Similar functions may be available in other packages; I recall hearing that SAS was developing this, but I haven't heard more).

Second, if you do have collinearity, you don't necessarily need to drop one variable. If your only goal is prediction, then collinearity can be left in. If you are also interested in explanation or interpretation of the parameter estimates, you could consider ridge regression.

$\endgroup$
2
  • $\begingroup$ I hadn't heard about the perturb package so I took a look. It has been removed from CRAN & it can't be installed with install.packages("perturb"). Can you recommend another package that has the same functionality? $\endgroup$
    – dipetkov
    Commented Dec 20, 2023 at 12:21
  • 1
    $\begingroup$ Dang! I wonder why? Sorry, but I don't know of another package that does that. However, if you have RTools, it seems that you can use archived packages and those are available for perturb. Note that I haven't done this, and am not really recommending it, as I don't know what's going on. $\endgroup$
    – Peter Flom
    Commented Dec 20, 2023 at 12:31
3
$\begingroup$

Normally collinearity between continuous or discrete variables can be easily determined by using variance inflation factor (VIF). However, since you are trying to figure out if there is collinearity based on a categorical predictor, you may need to rely upon a generalized version of variance inflation factor (GVIF). In this answer, I show how this is mathematically composed and how one can program it in R by-hand or with the check_collinearity function in the performance package. This should provide some evidence for collinearity if it is indeed present. But as Peter already mentioned in his answer, this may or may not be an issue depending on your purpose here.

$\endgroup$
2
  • 2
    $\begingroup$ VIF is fine, but looking at a scatter plot matrix, a correlation matrix and thinking about the meaning of each predictor to me come first! $\endgroup$
    – Nick Cox
    Commented Dec 20, 2023 at 14:56
  • $\begingroup$ I would have to agree on that point. $\endgroup$ Commented Dec 20, 2023 at 15:13

Your Answer

By clicking “Post Your Answer”, you agree to our terms of service and acknowledge you have read our privacy policy.

Not the answer you're looking for? Browse other questions tagged or ask your own question.