3
$\begingroup$

I want to compare the means of 2 sets of data. I have already taken the log and removed spurious outliers.

But the 2 sets have different shapes and I don't want to blindly throw them into a linear model.

Any tips?

One set is called liv and the other is called noliv. noliv is probably going to have a larger mean but using an appropriate test is the issue.

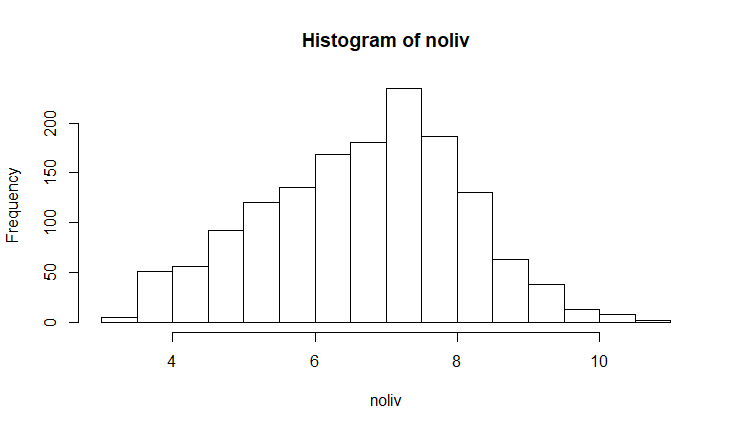
Is there any more general statistical test I can use here that doesn't assume normality. Obviously liv is normal but noliv isn't.

Even if the best answer is "take the log again", can someone please recommend a second best option to this?

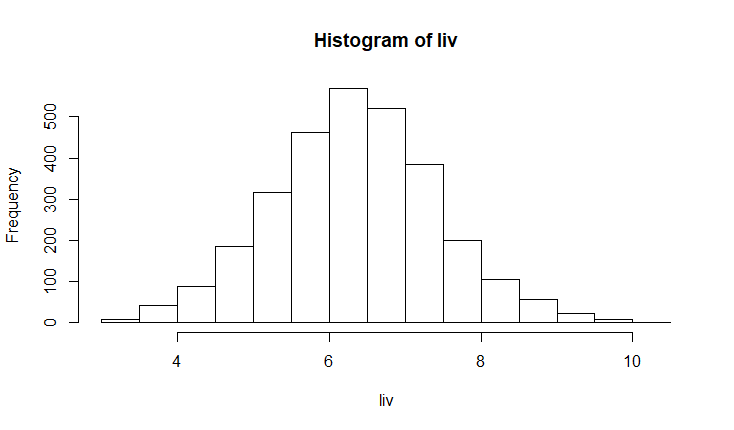
histogram of liv dataset

histogram of noliv dataset

$\endgroup$

1 Answer 1

1
$\begingroup$

If you want to compare means, do not take logs first. $(1,4)$ has a larger mean than $(2,2)$, but $(\log 1,\log 4)$ has the same mean as $(\log 2, \log 2)$. You can easily find examples where the relation of means is swapped by taking logs.

The standard t test for equality of means only relies on the normal distribution of means, not on the normal distribution of the original data. And the Central Limit Theorem yields that these means are indeed asymptotically normally distributed for most "reasonable" distributions of the original data. So I would use a t test on your data without a moment's hesitation.

Alternatively, you can run a permutation test for equality of means.

However, you apparently have quite a large sample, so even small deviations from equality will be statistically significant. You will need to decide whether these differences are "clinically" significant. And whether means are the best way to look at your original question at all.

$\endgroup$
3
  • $\begingroup$ An excellent point about the central limit theorem. I wasn't aware. t-test is what I'll go with. I'm right in thinking that by taking the log then I'm comparing geometric mean? $(1,4)$ and $(2,2)$ have the same geometric mean and so their logs have the same arithmetic mean? $\endgroup$ Commented Dec 12, 2019 at 15:11
  • $\begingroup$ That is exactly right! (The geometric mean may well be what you are interested in. Just be sure to think about what you want.) $\endgroup$ Commented Dec 12, 2019 at 15:24
  • 1
    $\begingroup$ I was not particularly overwhelmed by the statement that you "removed spurious outliers". Unless they are actual measurement errors (or typos), I cannot see the rational for such intrusive redacting. What is your evidence for "spurious"? $\endgroup$
    – Carsten
    Commented Dec 12, 2019 at 15:36

Your Answer

By clicking “Post Your Answer”, you agree to our terms of service and acknowledge you have read our privacy policy.

Not the answer you're looking for? Browse other questions tagged or ask your own question.