1
$\begingroup$

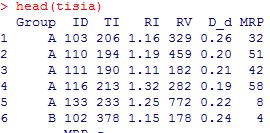
I have to look for the affect of crater degradation, rim irregularity (RI), radii variation (RV), depth-diameter rati (Dd) and mantled rim percentage (MRP) on crater rim thermal inertia. 138 craters (ID) were analyzed which are nested within 18 scenes (Scenes). Thermal inertia values depends on the error associated with that individual scenes.

Also I have to look for the error between thermal inertia and rim irregularity based on repeat measurement, and vice versa.

To test correlation between TI and RI

M0 <- lmer(TI ~ RI + RV + Dd + MRP + (RI | Scene)
M1 <- lmer(TI ~ RV + Dd + MRP + (RI | Scene)
anova(M1, M0)

How to estimate the error between TI and RI, TI and RV, TI~Dd respectively?

I want to know if I am on the right track or not ?

enter image description here

$\endgroup$
9
  • $\begingroup$ What exactly do you mean by error ? $\endgroup$ Commented Feb 6, 2020 at 8:03
  • $\begingroup$ I have to plot error bars for the relationship between thermal inertia and rim irregularity of craters covered by different scenes, The TI values within a scene are dependent on the error associated with that individual scene, so for every scene error must be computed. The scene itself has 20% error. $\endgroup$
    – Farzana
    Commented Feb 6, 2020 at 8:30
  • $\begingroup$ That doesn't tell me what you mean by "error" ? For example are you trying to estimate a measurement error, are you talking about standard error , or something else entirely. What is your actual research question ? $\endgroup$ Commented Feb 6, 2020 at 8:40
  • $\begingroup$ Sorry, I am talking about standard error. $\endgroup$
    – Farzana
    Commented Feb 6, 2020 at 8:52
  • $\begingroup$ How to plot scatter plot with error bars for individual scenes? $\endgroup$
    – Farzana
    Commented Feb 6, 2020 at 8:59

0

Your Answer

By clicking “Post Your Answer”, you agree to our terms of service and acknowledge you have read our privacy policy.

Browse other questions tagged or ask your own question.