1
$\begingroup$

I have a time-series database of users and their growth on our platform over time. I am trying to determine from this database users who are showing a consistent growth over time (and especially exponential growth). However, I am struggling to determine between users who have grown consistently over a period of time, against those who have grown very quickly over 1-2 days and then stopped growing.

(excuse the crudely drawn diagrams)

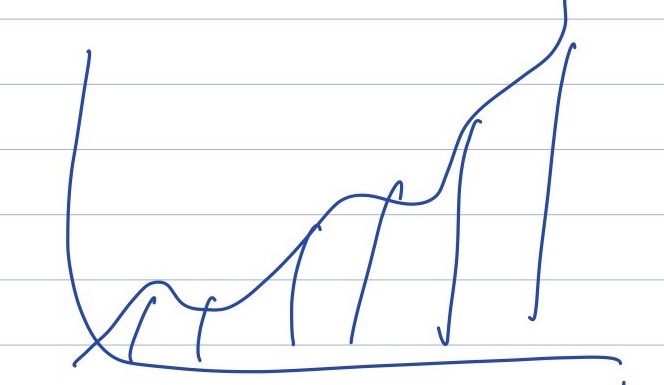
Effectively I want to find people with this type of growth (and give them a high score):

enter image description here

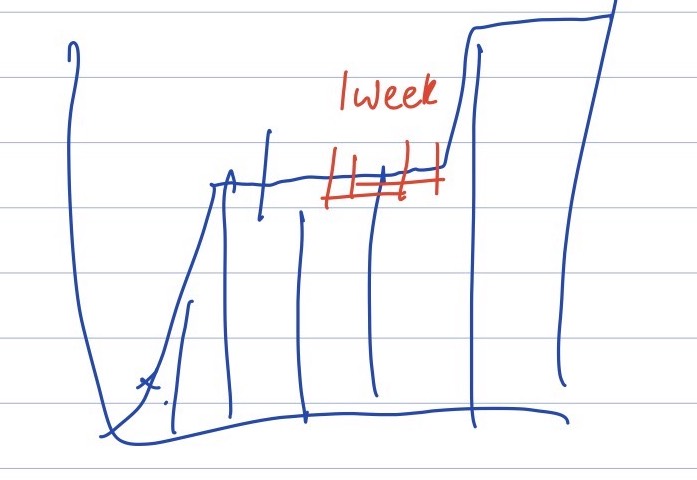
And give people a lower score when their growth looks like this:

enter image description here

Adding to this, its more important to see the increase in growth relatively, rather than absolutely.

I would be interested to know what sort of approach would allow me to score these correctly.

$\endgroup$

1 Answer 1

0
$\begingroup$

You can look at the variance of the growth derivative (or its discrete approximation, the difference between neighboring points).

For those with a consistent growth, the derivative will likely be some positive number, more or less constant over time, i.e. with low variance.

For spiked growth, the derivative will be zero when no growth is taking place, and quite large at "spikes".

Edit:

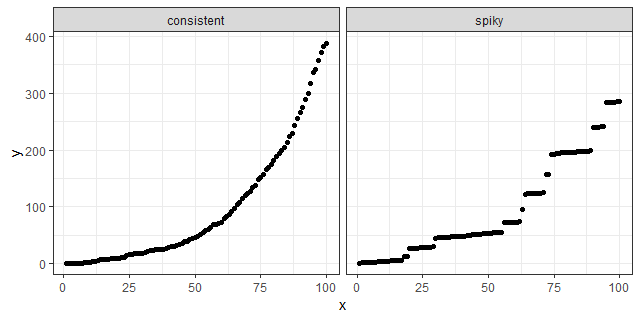
Assume your users' growth can be represented by the images:

growth-synthetic

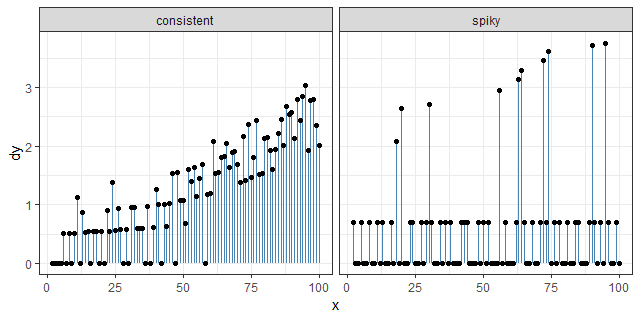
The log(1+daily differences) is then:

diffs-synthetic

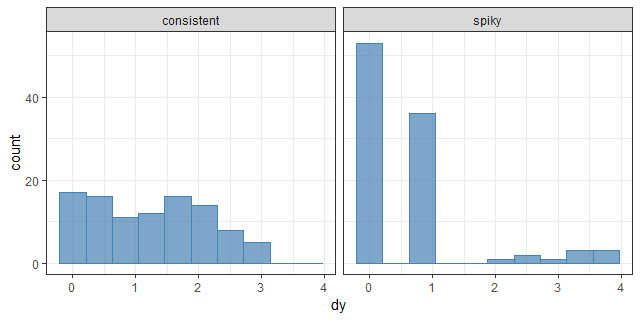
If you plot their histogram, you'll see that the consistent users have a more-or-less uniform log-growth, while the for the spiky ones it is mostly close to zero, but occasionally quite large:

histogram-synthetic

You can quantify it by kurtosis:

e1071::kurtosis(dy1)
[1] -1.050228

e1071::kurtosis(dy2)
[1] 4.022098
$\endgroup$
4
  • $\begingroup$ Thanks for this. How would this vary with "more exponential" growth - the variance would be high, but with a positive derivative? How would that compare to linear growth? $\endgroup$
    – Nick Dart
    Commented Feb 27, 2020 at 12:59
  • $\begingroup$ If you expect exponential growth, you can take a logarithm of the differences. That would make them constant for the consistent growth group, but still spiky (albeit less so) for the other group. $\endgroup$
    – Igor F.
    Commented Feb 27, 2020 at 13:20
  • $\begingroup$ Ok, so would the steps be: 1. get followers over time data 2. find growth between each point (followers gained in a day) 3. find the differences between each of these 4. take the log of these 5. take the average of this? Is that correct? $\endgroup$
    – Nick Dart
    Commented Feb 28, 2020 at 13:24
  • $\begingroup$ In step 4, I'd use log(1+difference), to account for possible zero growth. Regarding 5, I updated the answer. $\endgroup$
    – Igor F.
    Commented Feb 28, 2020 at 14:53

Your Answer

By clicking “Post Your Answer”, you agree to our terms of service and acknowledge you have read our privacy policy.

Not the answer you're looking for? Browse other questions tagged or ask your own question.