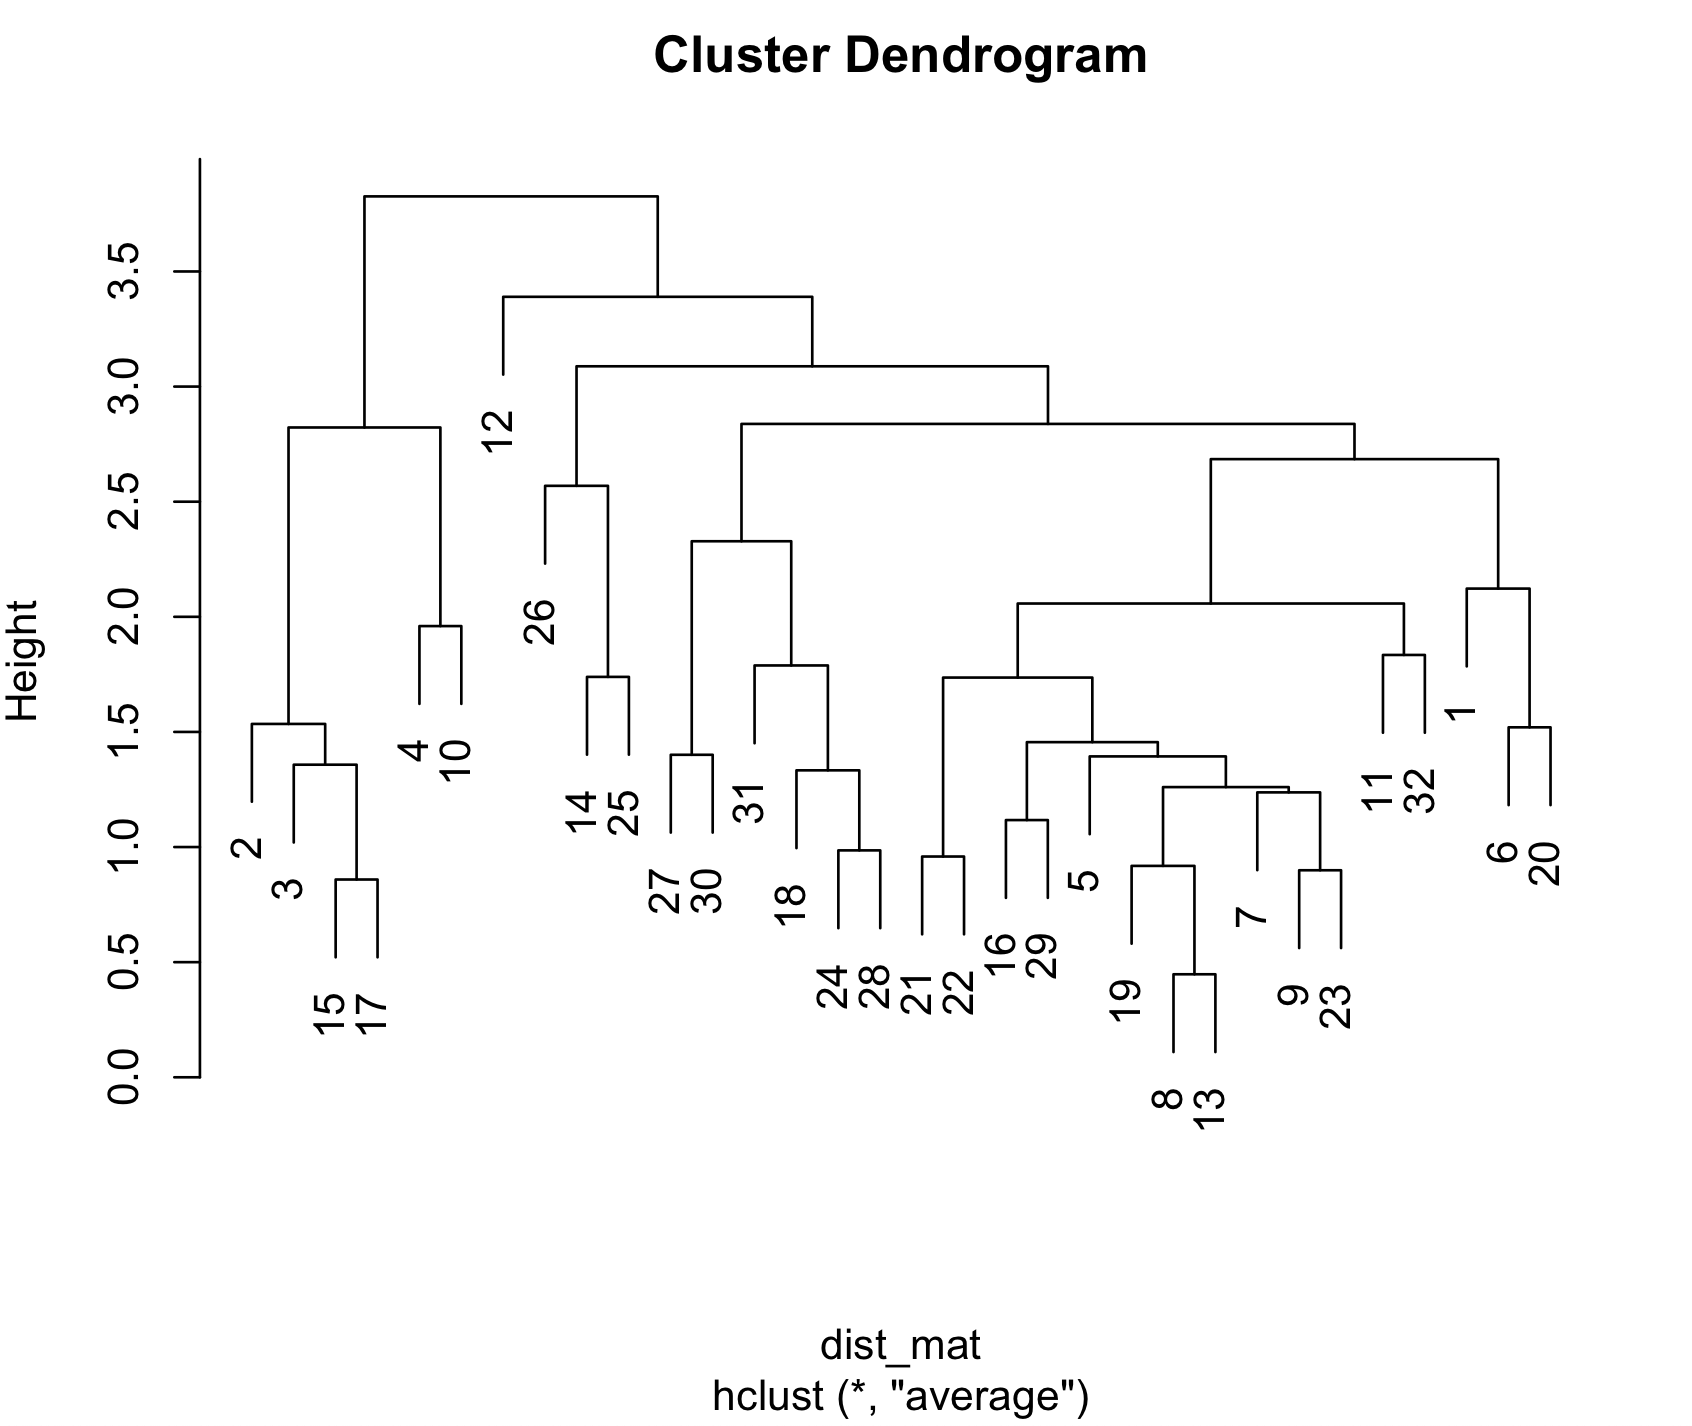
Because you're comparing the dendogram for hierarchical cluster analysis (HCA) based on Euclidean distance with a multivariate means test -- which are by no means similar comparisons. You can always have noisy and jumpy data with outliers present, which will cause jumpyness in the dendogram results.
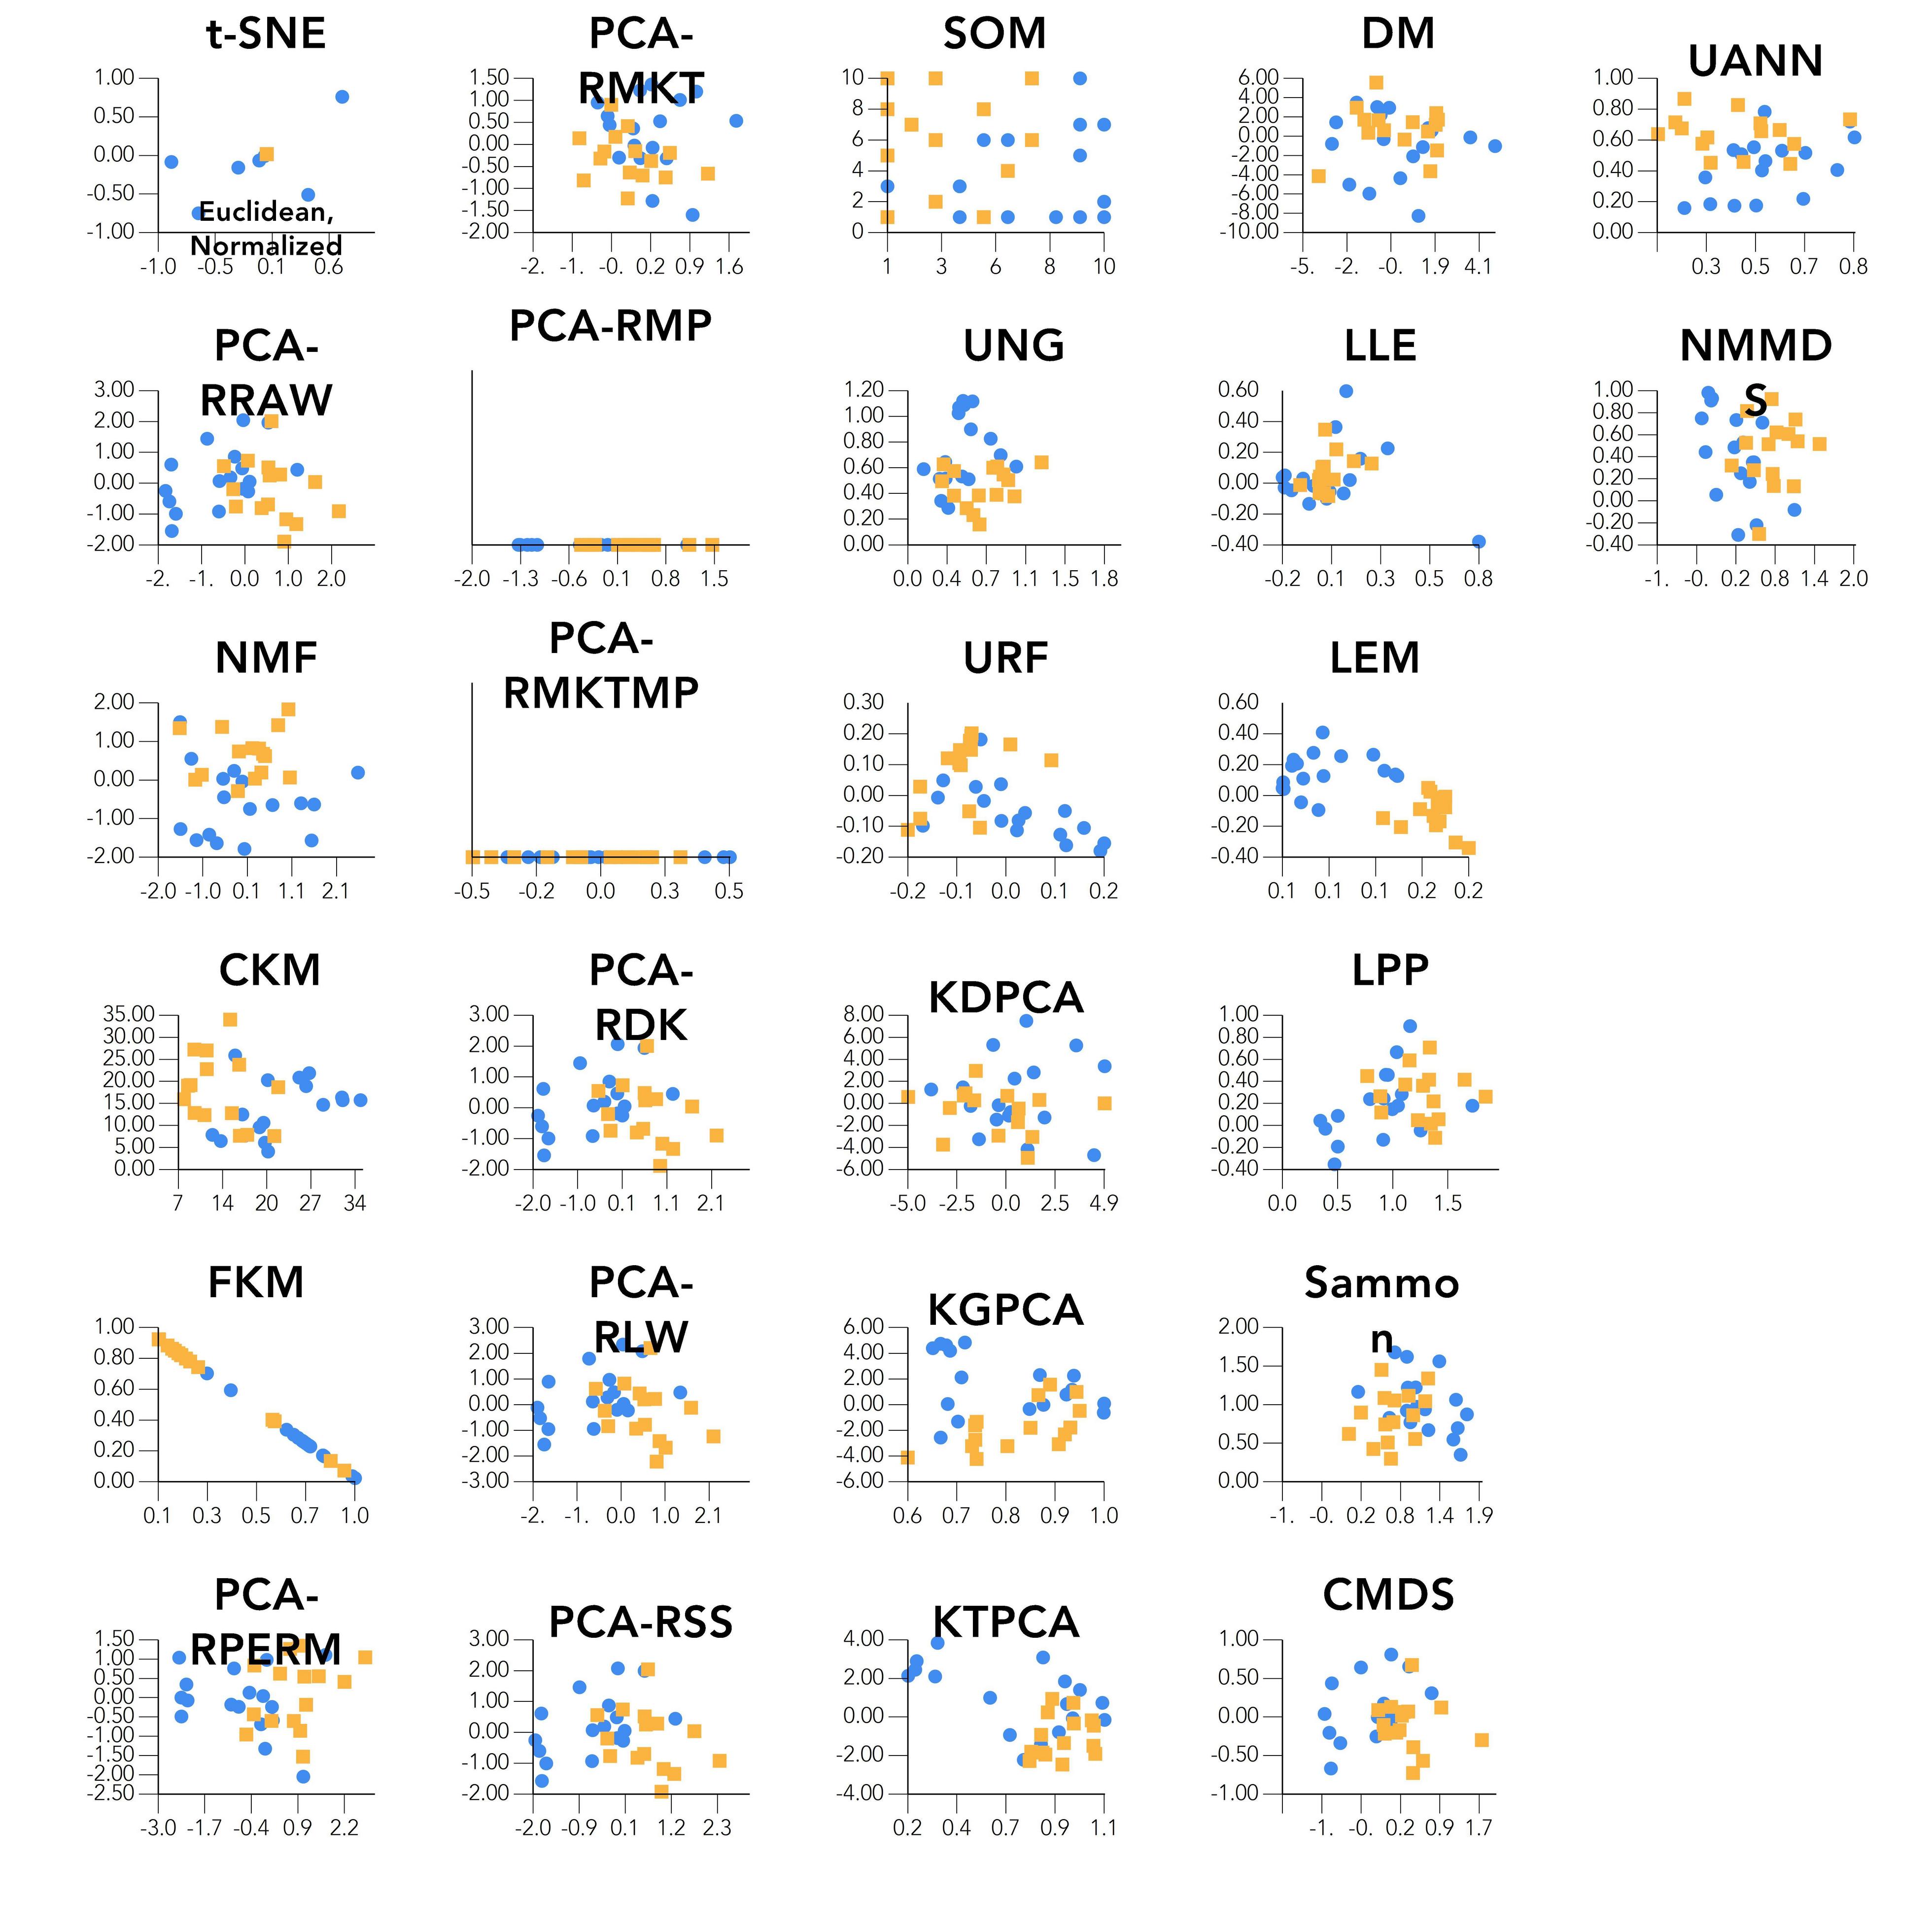
With multiple features, it's always difficult to show why multivariate-based averages are different across groups, since it's not that straightforward. Below is a 2D score plot for a variety of unsupervised methods: and Laplacian Eigenmaps (LEM) shows separation between the two classes. NMF does as well, but not as good. I couldn't get any HCA results using various distance metrics which partition the objects into two separate clusters, mostly due to the overlap of feature values across the two groups.

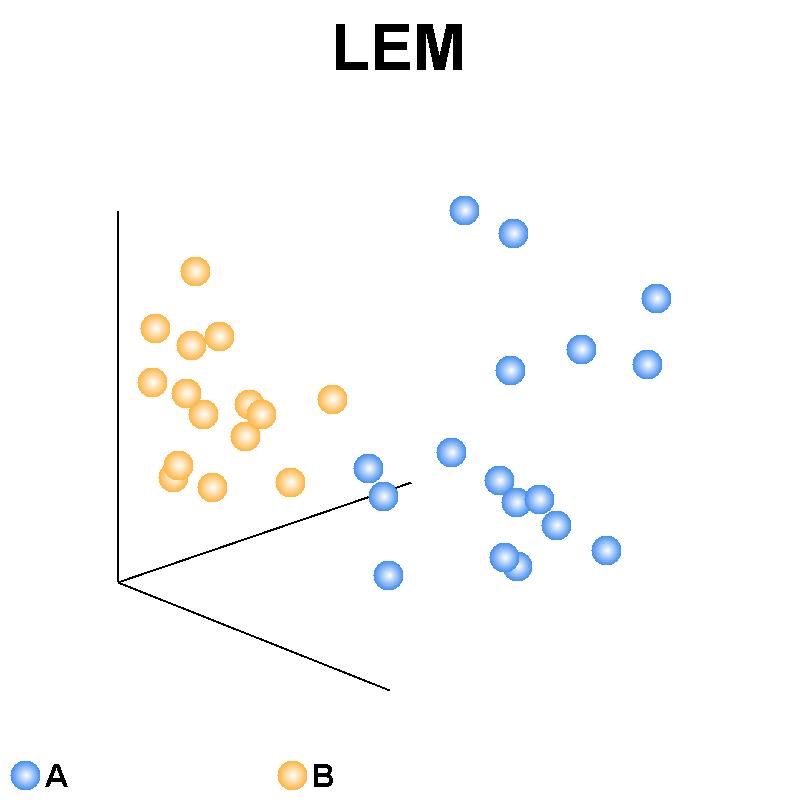
Also, below is a 3D run using LEM:


