25
$\begingroup$

I have an assignment (Data Mining course) and there is a part which asks: "What are the disadvantages of using mean for missing values?" in Missing Value section.

So I searched a little bit and the most common answer was: "Because it reduces the variance."

Why is this variance reduction considered as a bad thing? And is there any other disadvantage other that variance reduction?

$\endgroup$

6 Answers 6

33
$\begingroup$

Example with normal data. Suppose the real data are a random sample of size $n=200$ from $\mathsf{Norm}(\mu=100, \sigma=15),$ but you don't know $\mu$ or $\sigma$ and seek to estimate them. In the example below I'd estimate $\mu$ by $\bar X = 100.21$ and $\sigma$ by $S = 14.5,$ Both estimates are pretty good. (Simulation and computations in R.)

set.seed(402)  # for reproducibility
x = rnorm(200, 100, 15)
mean(x);  sd(x)
# [1] 100.2051   # aprx 100
# [1] 14.5031    # aprx 15

Now suppose that 25% of these data are missing. (That's a large proportion, but I'm trying to make a point.) If I replace the missing observations by the mean of the 150 non-missing observations, let's see what my estimates of $\mu$ and $\sigma$ would be.

x.nonmis = x[51:200]  # for simplicity suppose first 50 are missing
x.imputd = c( rep(mean(x.nonmis), 50),  x.nonmis )
length(x.imputd);  mean(x.imputd);  sd(x.imputd)
# [1] 200               # 'x.imputd' has proper length 200
# [1] 100.3445          # aprx 100
# [1] 12.58591          # much smaller than 15

Now we estimate $\mu$ as $\bar X_{imp} = 100.3,$ which is not a bad estimate, but potentially (as here) worse than the mean of the actual data. However, we now estimate $\sigma$ as $S_{imp} = 12.6,$ which is quite a bit below both the true $\sigma$ and its better estimate 14.5 from actual data.


Example with exponential data. If the data are strongly right-skewed (as for data from an exponential population), then replacing missing data with the mean of nonmissing data could mask the skewness so that we may be surprised that the data do not reflect how heavy the right tail of the population really is.

set.seed(2020)  # for reproducibility
x = rexp(200, .01)
mean(x);  sd(x)
# [1] 108.0259   # aprx 100
# [1] 110.1757   # aprx 100
x.nonmis = x[51:200]  # for simplicity suppose first 50 are missing
x.imputd = c( rep(mean(x.nonmis), 50),  x.nonmis )
length(x.imputd);  mean(x.imputd);  sd(x.imputd)
# [1] 200
# [1] 106.7967   # aprx 100
# [1] 89.21266   # smaller than 100
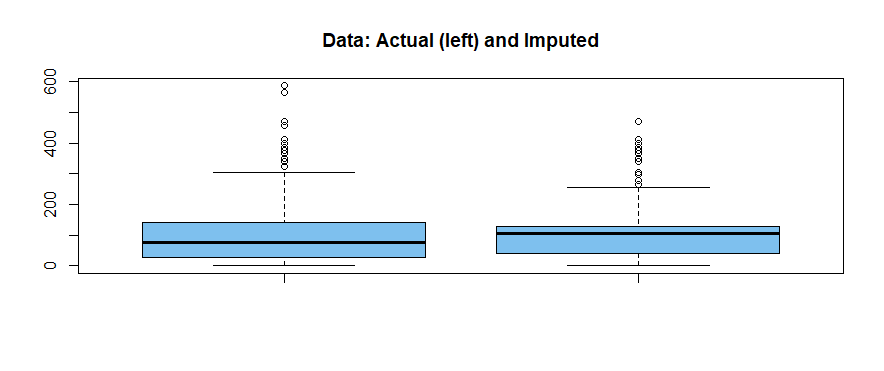
boxplot(x, x.imputd, col="skyblue2", main="Data: Actual (left) and Imputed")

The boxplot shows more skewness in the actual data (many observations in high tail) than in the 'imputed' data.
enter image description here


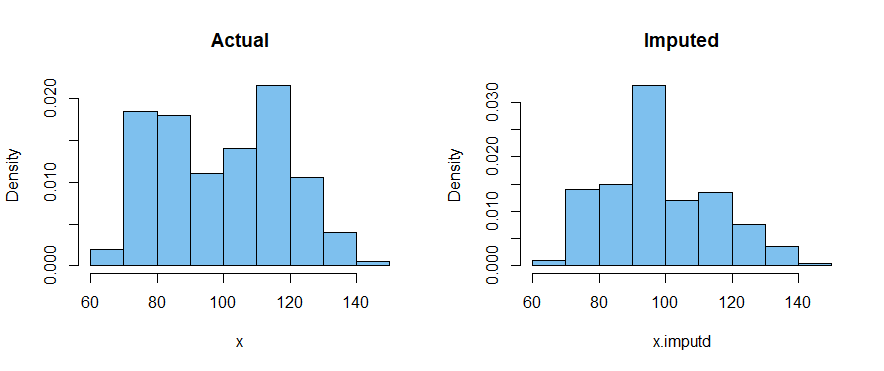
Example with bimodal data. Again here, when we substitute missing values with the mean of the nonmissing observations, the population standard deviation is underestimated. Perhaps more seriously, the large number of imputed values at the center of the 'imputed' sample masks the bimodal nature of the data.

set.seed(1234)  # for reproducibility
x1 = rnorm(100, 85, 10);  x2 = rnorm(100, 115, 10)
x  = sample(c(x1,x2))  # randomly scramble order
mean(x);  sd(x)
# [1] 99.42241
# [1] 18.97779
x.nonmis = x[51:200]  # for simplicity suppose first 50 are missing
x.imputd = c( rep(mean(x.nonmis), 50),  x.nonmis )
length(x.imputd);  mean(x.imputd);  sd(x.imputd)
# [1] 200
# [1] 99.16315
# [1] 16.41451
par(mfrow=c(1,2))
 hist(x,        prob=T, col="skyblue2", main="Actual")
 hist(x.imputd, prob=T, col="skyblue2", main="Imputed")
par(mfrow=c(1,1))
enter image description here

In general: Replacing missing data by the mean of nonmissing data causes the population SD to be underestimated, but may also obscure important features of the population from which the data were sampled.


Note: As @benso8 observes, using the mean of nonmissing data to replace missing observations is not always a bad idea. As mentioned in the Question, this method does reduce the variability. There will necessarily be drawbacks to any scheme for dealing with missing data. The Question asked for speculation about possible disadvantages other than variance reduction for this method. I tried to illustrate a couple of possibilities in my last two examples.

Tentative alternative method: I am no expert in data mining. So I very tentatively propose an alternative method. I don't claim it's a new idea.

Instead of replacing all $m$ missing items with the sample mean of the nonmissing ones, one might take a random sample of size $m$ from among the nonmissing observations, and scale it so that the $m$ items have the same mean and SD as the nonmissing data. Then combine the rescaled $m$ items with the nonmissing ones to get an 'imputed' sample with nearly the same mean and SD as the nonmissing part of the sample.

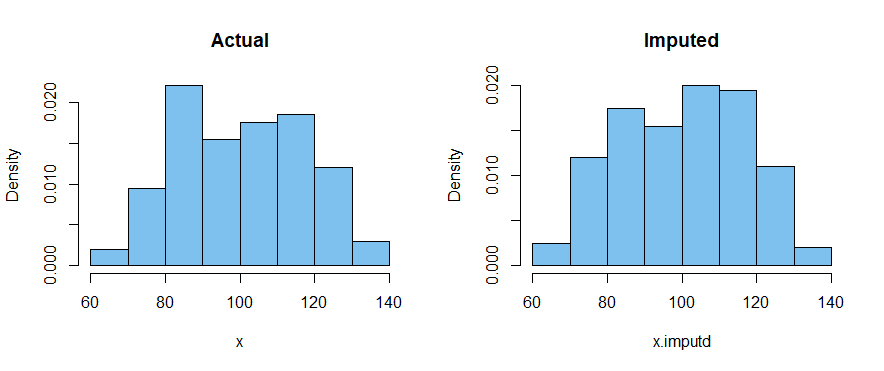
The result should not systematically underestimate the population SD, and may better preserve features of the population such as skewness and bimodality. (Comments welcome.)

This idea is explored for bimodal data below:

set.seed(4321)  # for reproducibility
x1 = rnorm(100, 85, 10);  x2 = rnorm(100, 115, 10)
x  = sample(c(x1,x2))  # scrmble
mean(x);  sd(x)
# [1] 100.5299
# [1] 17.03368
x.nonmis = x[51:200]  # for simplicity suppose first 50 are missing
an       = mean(x.nonmis);  sn = sd(x.nonmis)   
x.subt   = sample(x.nonmis, 50)      # temporary unscaled substitutes
as       = mean(x.subt); ss = sd(x.subt)
x.sub    = ((x.subt - as)/ss)*sn + an # scaled substitutes

x.imputd = c( x.sub,  x.nonmis )
mean(x.imputd);  sd(x.imputd)
# [1] 100.0694    # aprx same as mean of nonmissing
# [1] 16.83213    # aprx same os SD of nonmissing

par(mfrow=c(1,2))
 hist(x,        prob=T, col="skyblue2", main="Actual")
 hist(x.imputd, prob=T, col="skyblue2", main="Imputed")
par(mfrow=c(1,1))
enter image description here

$\endgroup$
3
  • 5
    $\begingroup$ I really like your idea of substituting missing values with a random sample with the mean and the variance that matches the actual data. As you point out, provided the sample is large enough, this should not systematically skew a model or inferences derived from the data. The only case I can think of where using simulated data for missing values with similar mean and variance might be a bad idea is if for some reason the missing values were correlated in some way and were all outliers. Just and edge case though really. $\endgroup$
    – benso8
    Commented Apr 3, 2020 at 4:07
  • 2
    $\begingroup$ Yes, the lurking horror of missing data is the worry that the same thing that causes blanks is messing with the normal state of the the process. Don't see a way to guard against that. $\endgroup$
    – BruceET
    Commented Apr 3, 2020 at 6:16
  • 4
    $\begingroup$ I believe your suggested method is a version of hot deck imputation (cf, here: Hot deck imputation, ''it preserves the distribution of the item values'', how can that be?). $\endgroup$ Commented Apr 4, 2020 at 15:56
9
$\begingroup$

Using the mean for missing values is not ALWAYS a bad thing. In econometrics, this is a recommended course of action in some cases provided you understand what the consequences may be and in what cases it is helpful. As you have read, replacing missing values with the mean can reduce the variance but there are other side effects as well. Consider for example what happens to a regression model when replacing missing values with the mean.

Note that for regression models the coefficient of determination $$R^2 = \frac{SSR}{SSTO} = \frac{\sum (\hat{y_i} - \bar{y})^2}{\sum (y_i - \bar{y})^2}.$$ Assuming you have missing $y$ values and you replace those with the sample mean then you can have a $R^2$ value that is not as realistic as it should be. More variance in the data means there is more data that is likely further away from the regression line. Since the $R^2$ value depends on individual observed $y$ values (see $y_i$ in $SSTO$), your $R^2$ could be inflated because $SSTO$ will be smaller.

Let's look at an example.

Say you have a value $x_3$ and the corresponding observation for that $x$ value was $y_3$. We do the calculation for that result for SSTO and we have

$$ (y_3 - \bar{y})^2 $$

and that result gets added to the sum for $SSTO$. Now, instead, let's say that value $y_3$ is missing. We then let the missing $y_3 = \bar{y}$. We then have

$$ (\bar{y} - \bar{y})^2 = 0. $$.

As you can see, when we add this to the other results for the denominator the $SSTO$ sum will be smaller.

$\endgroup$
3
  • $\begingroup$ I don't understand how your example supports the claim that it's not always bad. Your example is that the resulting $R^2$ is biased to be too high. Why would that be advantageous? Am I missing something here? $\endgroup$ Commented Apr 4, 2020 at 16:00
  • $\begingroup$ @gung-ReinstateMonica I was providing additional information to the original question. The original question stated "Why is this variance reduction considered as a bad thing? " I wanted to clarify that it is not always a bad thing. I then confirmed that it can, however, decrease the variance and gave an example of where that can be an issue. $\endgroup$
    – benso8
    Commented Apr 4, 2020 at 18:41
  • $\begingroup$ @benso8 You say: "Using the mean for missing values is not ALWAYS a bad thing." so can you give a realistic example where this approach would be a neutral or a good thing? $\endgroup$
    – user215517
    Commented Oct 27, 2021 at 1:06
7
$\begingroup$

Another possible disadvantage with using the mean for missing values is that the reason the values are missing in the first place could be dependent on the missing values themselves. (This is called missing not at random.)

For example, on a health questionnaire, heavier respondents may be less willing to disclose their weight. The mean of the observed values would be lower than the true mean for all respondents, and you'd be using that value in place of values that should actually be considerably higher.

Using the mean is less of an issue if the reason the values are missing is independent of the missing values themselves.

$\endgroup$
2
  • $\begingroup$ I don't see why mean imputation is less of an issue if the data are NMAR. It seems like it would be even worse in that case than in the MCAR case. $\endgroup$ Commented Apr 4, 2020 at 16:01
  • $\begingroup$ @gung-ReinstateMonica I'd say the answer agrees with your comment, although double negations make both a bit contrieved. $\endgroup$
    – Pere
    Commented Apr 5, 2020 at 12:23
3
$\begingroup$

The problem isn’t specifically that it reduces the variance, but that it changes the variance of the dataset, making it a less accurate estimate for the variance of the actual population. More generally, it will make the dataset a less accurate reflection of the population, in many ways.

It’s helpful to consider alternatives. Why would using 0 (or any other random value) for missing points be a bad idea? Because it would be changing the dataset in an artificial way, making it less reflective of the ideal population, and making conclusions you draw from the dataset less accurate. Why is using the mean for missing points less bad than using other values? Because it doesn’t change the mean of the dataset — and the mean is usually the most important single statistic. But it’s still just a single statistic! The whole point of data mining is that a dataset contains much more information besides the mean. Filling in missing points with the mean can affect all the rest of that information. So the filled-in dataset will be less accurate for drawing conclusions about the actual population. The variance is just one particular piece of that further information, that illustrates the changes clearly.

$\endgroup$
0
$\begingroup$

"Why is this variance reduction considered as a bad thing?"

As an oversimplified example: imagine, for a moment, that you have an extremely small economy on an island somewhere, with just 5 people. Their Annual Incomes are as follows:

  • Person 1: ♦10,000
  • Person 2: ♦10,000
  • Person 3: ♦12,000
  • Person 4: ♦13,000
  • Person 5: ♦25,000

A car company seeking to "break into the market" decide to price their vehicles based on the Average Annual Earnings.

Mean: ♦14,000
Median: ♦12,000
Mode: ♦10,000

As you can see, using the Mode could exclude 80% of the population from buying their product, which makes it a very bad choice for building a business case!

$\endgroup$
2
  • 1
    $\begingroup$ Come to think of it - apply this to the USA: Mean Income for 2018 was \$50.4k, Median was \$33.7k. Health insurance premiums were about \$20.5k... $\endgroup$ Commented Apr 3, 2020 at 10:57
  • $\begingroup$ Imputing the median or mode does not solve the problem of variance reduction. $\endgroup$ Commented Apr 3, 2020 at 22:35
0
$\begingroup$

Yes, I like to idea of sampling from a distribution, when one has many missing values, to get a replacement value for missing value k.

My choice, however, is a distribution centered at the sample median (not mean) and with variance given here https://www.jstor.org/stable/30037287?seq=1 .

Perhaps sample from a truncated normal based upon the above parameters.

$\endgroup$

Your Answer

By clicking “Post Your Answer”, you agree to our terms of service and acknowledge you have read our privacy policy.

Not the answer you're looking for? Browse other questions tagged or ask your own question.