This is my problem: I use data observed with MUSE (which is an astronomical instrument provides cubes, i.e. an image for each wavelength with a certain range, link ) to extract a measure of redshift. Let's call the MUSE cube with $S_{ij}$, where $i$ labels the pixels (i.e. flattening the image, $i \in [0, ..., h\cdot w)$) and $j$ labels the wavelength ($j \in [0, N_\lambda)$). In order to perform such measure, I cross-correlate the spectra (obtained from the MUSE cube extracting the wavelength information corresponding to a pixel, i.e. $S_i$), with a set of templates, which are spectra obtained from known sources, since these templates are redshifted, founding the best cross-matched value (i.e. the maximum of the cross-correlation function for each pixel), I get the redshift (the set of templates is represented with a matrix $T_{jk}$, where $j\in 0,N_\lambda$, and $k\in [0, N_z)$, i.e. a column ($k$) of this matrix is the spectra at $z_k$). This a common and widely-used process and, indeed, it works well.
My question regards the error with which I measure the best redshift (let's call it as $z_{best}$). In fact, MUSE provides also an error for each pixel and for each wavelength, $\sigma_{ij}$ (simplifying the notation, actually it should be written as $\sigma_{S_{ij}}$). I have propagated these error through the cross-correlation relation: $$X_{ik} = \frac{\sum_j S_{ij}T_{jk}}{\sqrt{\sum_jS_{ij}^2\cdot\sum_jT_{jk}^2}} = \frac{\sum_j S_{ij}T_{jk}}{\sqrt{SSS_i\cdot SST_k}} = \frac{\sum_j S_{ij}T_{jk}}{N_{ik}} $$ where $X_{ik}$ is the cross-correlation related to the pixel $i$, to the redshift $z_k$, $SSS_i$ and $SST_k$ are the sum of the squared of the spectra relate to the pixel $i$ (or template related to the redshift $z_k$), $N_{ik}$ is a normalization coefficient.
Using the error-propagation rules, and assuming the templates without error, I have an error on $X_{ik}$:
$$\sigma_{X_{ik}}^2 = \sum_j \Big(\frac{\partial X_{ik}}{\partial S_{ij}}\Big)^2\sigma_{ij}^2 = \frac{\sum_j\sigma_{ij}^2T_{jk}^2}{N_{ik}^2} + \frac{X_{ik}^2SST_k^2\sum_jS_{ij}\sigma_{ij}^2}{N_{ik}^4} - 2 \frac{X_{ik}SST_k\sum_j(S_{ij}\sigma_{ij}^2)T_{jk}}{N_{ik}^3}
$$
The code has been implemented using python and tensorflow (tf) in order to exploit the GPU:
@tf.function
def make_xcorr_err1(T, S, sigma_S):
    sum_spectra_sq = tf.reduce_sum(tf.square(S), 1) #shape (batch,)
    sum_template_sq = tf.reduce_sum(tf.square(T), 0) #shape (Nz, )
    norm = tf.sqrt(tf.reshape(sum_spectra_sq, (-1,1))*tf.reshape(sum_template_sq, (1,-1))) #shape (batch, Nz)
    xcorr = tf.matmul(S, T, transpose_a = False, transpose_b= False)/norm

    foo1 = tf.matmul(sigma_S**2, T**2, transpose_a = False, transpose_b= False)/norm**2
    foo2 = xcorr**2 * tf.reshape(sum_template_sq**2, (1,-1)) * tf.reshape(tf.reduce_sum((S*sigma_S)**2, 1), (-1,1))/norm**4
    foo3 = - 2 * xcorr * tf.reshape(sum_template_sq, (1,-1)) * tf.matmul(S*(sigma_S)**2, T, transpose_a = False, transpose_b= False)/norm**3

    sigma_xcorr = tf.sqrt(tf.maximum(foo1+foo2+foo3, 0.))
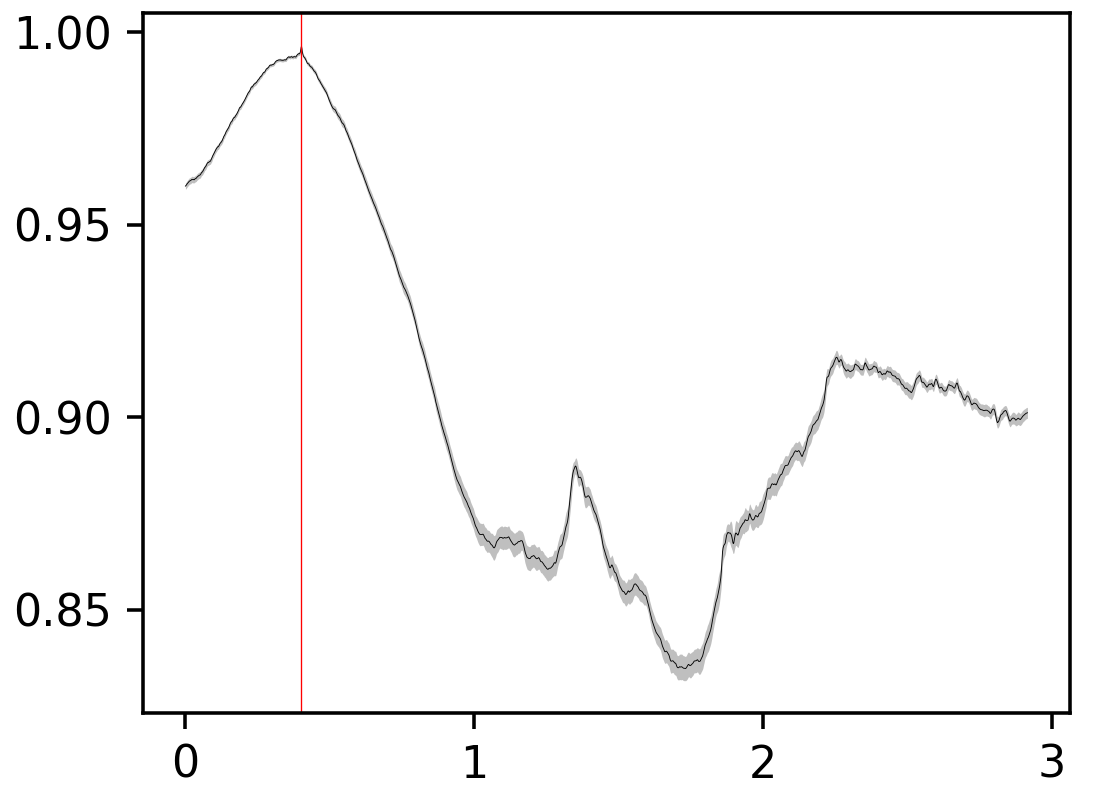
The follow image is the cross-correlation function for a pixel, i.e. $X_{ik}$ for a fixed $i$, $\forall k$, and the area between $\pm3\sigma$ is filled in grey:
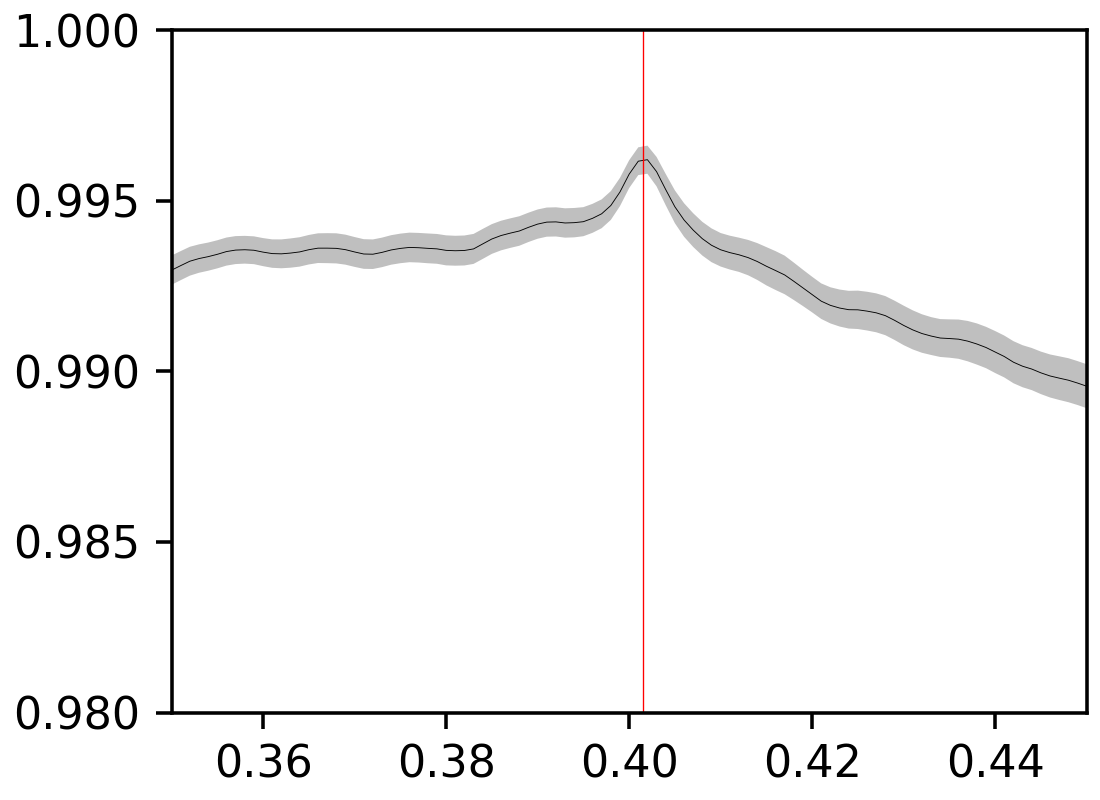
The red vertical line represents the detected maximum, corresponding to $z\sim0.404$ (which is correct, since I know the true redshift of this source). If a zoom-in around the maximum value:
As you can note, the maximum fluctuates within a range of values, i.e. the error of $X_{ik}$.
Thus my question is: How can I map these fluctations to error on $z_{best}$?
I have thought to some soultions:
For each pixel I can fit the cross-correlation function with a parabola centered around the maximum. Once I have an expression like $a_0 + a_1 z + a_2 z^2$, with a fitted error on $a_n$ and the covariance matrix, I can estimate the maximum and its error. I have discarded this solution since it requires a lot of time, I should fit a parabola for each pixel (my image is about $500\times500$ pixels), then there is the problem of the dimension of the range in $z$.
Trying a boot-strap method: I can generate hundreds of cross-correlation functions, constrained by the estimated errors. It would be as if there were hundreds of functions in the grey area, guassian generated. I can estimate the maximum for each of them, having an idea about the dispersion in $z$, the resulting $z_{best}$ is mean among the $z_{best_n}$. This is clearly faster than the previous method. Can be this approach correct? In this case, is better to use a median, instead of the mean? Is also better use an weighted median, and the error on $z_{best} $ measured as the weighted MAD?
What do you think?


