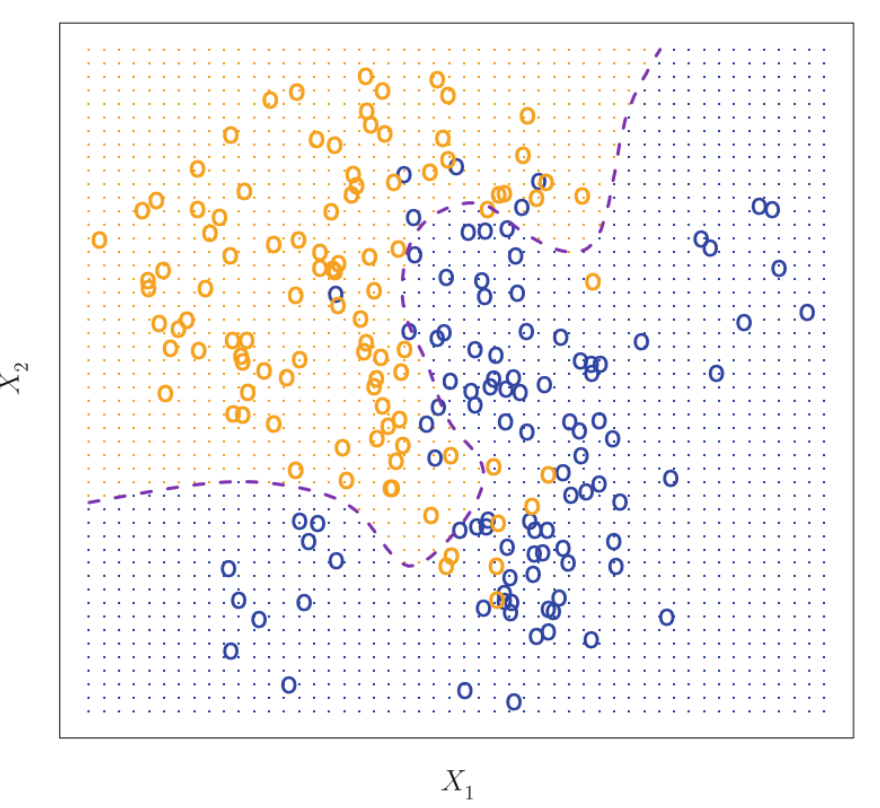
I playing around trying to emulate a visualization of the book Introduction to Statistical Learning, chapter 2, page 38.
My problem is that I cannot achieve to draw a decision boundary of a similar shape. I generated the data from two bivariate normal distributions and I obtained only a decision boundaries with parabolic shapes (using a naive bayes classifier).
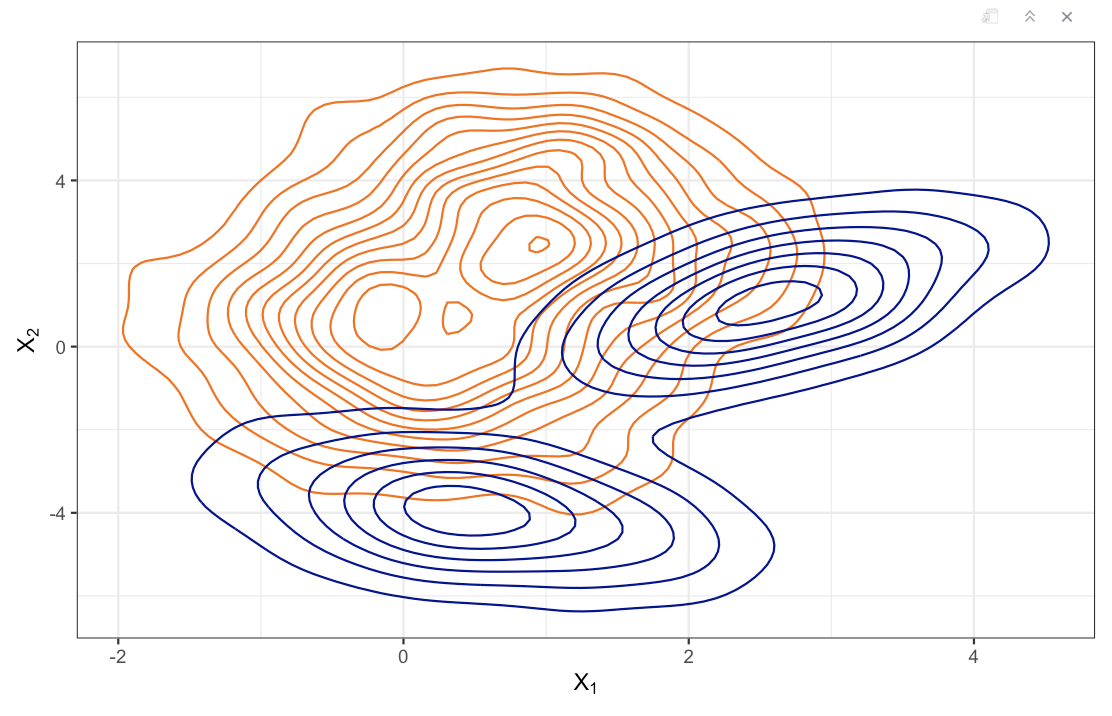
Then I pick the blue class from a mix of two bivariates normal distribution trying to generate some bimodal effect and obtain a more polynomial decision boundary but the plan didn't work.
Here is the visual way that I trying to tune the parameters to generate points. The blue are the two bivariate normal-distributions that I said before to generate 50 points from each other.
Someone who knows a way to generate data from a distribution to have control of the parameters and obtain a similar decision boundary as the first plot?


