4
$\begingroup$

Consider the data from this website.

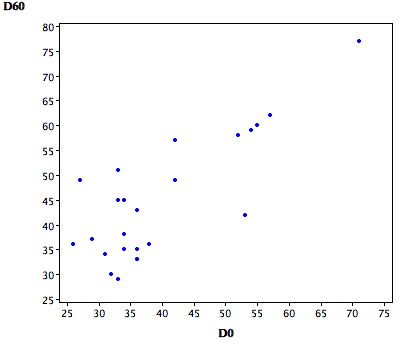
They present the attached graph and state

"It is clear that children who get more correct in the D0 condition tend to get more correct in the D60 condition. The correlation between the two conditions is high: r = 0.80. Clearly these two variables are not independent."

Why does correlation here mean that independence is violated?

The definition of independence on wikipedia says:

"two random variables are independent if the realization of one does not affect the probability distribution of the other."

I don't see how the presence of correlation implies that one variable affects the probability distribution of the other.

I mean, we can ASSUME that one variable being high affects the probability of the other variable being high. But here they are not stating it as an assumption but as a truth.

  • Why can it not be the case that there is some individual-specific factor at play? For example, Maybe certain subjects have a lot more probability mass on the right tail. This would give correlation, but I don't think it means that one variable being large affects the probability of the other variable being large

    Image from cited website showing correlation

(Aside: To whoever upvoted this prior to the major edit, my apologies if I have inadvertently changed what you were most interested in)

$\endgroup$
1

2 Answers 2

0
$\begingroup$

The value $0.80$ is such a high correlation that it’s basically impossible to get that kind of value from independent variables. You can (more or less) quantify this unlikeliness with a p-value, but you know going into the test that you’re going to reject a null hypothesis of zero correlation.

Do note that correlation is not necessary for dependence, as a post on Data Science discusses: https://datascience.stackexchange.com/questions/72824/what-is-the-meaning-of-a-quadratic-relation-when-r-0/72826#72826.

$\endgroup$
0
$\begingroup$

Both you and the authors of the analysis you quote are correct, but there is clarification to be made.

The above-mentioned authors are correct in saying that the two variables, $D0$ (outcome under placebo) and $D60$ (outcome under treatment) are not independent because each observation, consisting of a vector $(D0_i,D60_i)$, is an observation of outcomes under placebo and treatment for the same individual $i$.

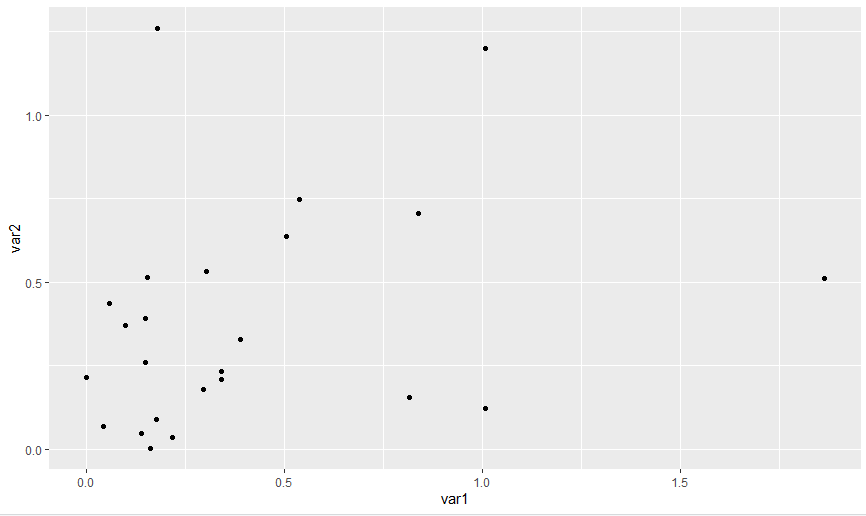
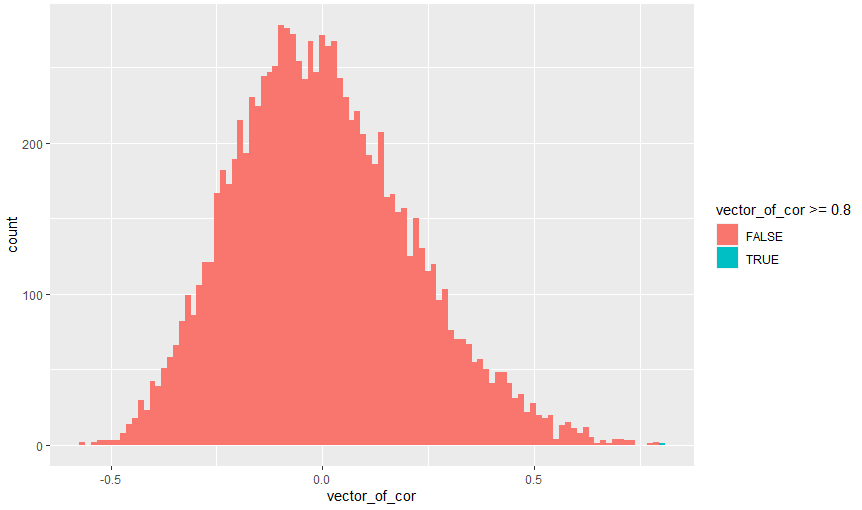
At the same time, you are correct to note that they state "Clearly these two variables are not independent" right after they say "The [sample] correlation between the two conditions is high: r=0.80", almost implying the latter as the reason for the former. Observing such a high correlation value based on a sample size of 24 makes it quite unlikely that the two variables are independent. A very rare event, but not an impossible one. The simulation below uses two i.i.d. random variables with a pdf that seems reasonable for this study to generate 10,000 random samples and calculate the correlation in each of these. In the particular 10,000 random samples displayed below, I found one sample with a correlation above 0.8.

Take $var1$ and $var2$ to be two identically distributed random variables, with the pdf given by $$f(y)=2*e^{-2y}, y>0$$

Using the inverse transform method, you can verify that the Inverse CDF is given by $-\frac{1}{2} ln(1-x)$, which explains why $var1$ and $var2$ below are assigned this expression.

install.packages("ggplot2")
library("ggplot2")

nobs<-24
x<-runif(nobs)
var1<--log(1-x)/2
x<-runif(nobs)
var2<--log(1-x)/2
df<-as.data.frame(cbind(var1,var2))
ggplot(df)+geom_point(aes(x=var1,y=var2))

Here is what one sample of 24 observations looks like:

Showing that the pdf used in the simulation is reasonable

vector_of_cor<-NULL
for (i in 1:10000) {
    x<-runif(nobs)
    var1<--log(1-x)/2
    x<-runif(nobs)
    var2<--log(1-x)/2
    vector_of_cor<-c(vector_of_cor,cor(var1,var2))
}

df<-as.data.frame(vector_of_cor)
ggplot(df)+geom_histogram(aes(x=vector_of_cor,fill=vector_of_cor>=0.8),bins = 100)

Here is what what the correlations of the 10,000 samples look like:

enter image description here

enter image description here

$\endgroup$

Not the answer you're looking for? Browse other questions tagged or ask your own question.