2
$\begingroup$

Can anyone help me out with this question I found on my practice paper?

The series $\{y_t\}$ is described by

$$ y_t = 5+0.3y_{t-1}+\epsilon_t+0.9\epsilon_{t-1}. $$

Identify the specific ARIMA model. What is the mean of the series $\{y_t\}$?

I think it is a ARMA (1,1) process? is that correct? And how do I calculate the mean of the ARMA model? Is it the same as AR model? If it is then

$$ E(y_t) = 5/ (1-0.30) = 7.14?$$


enter image description here

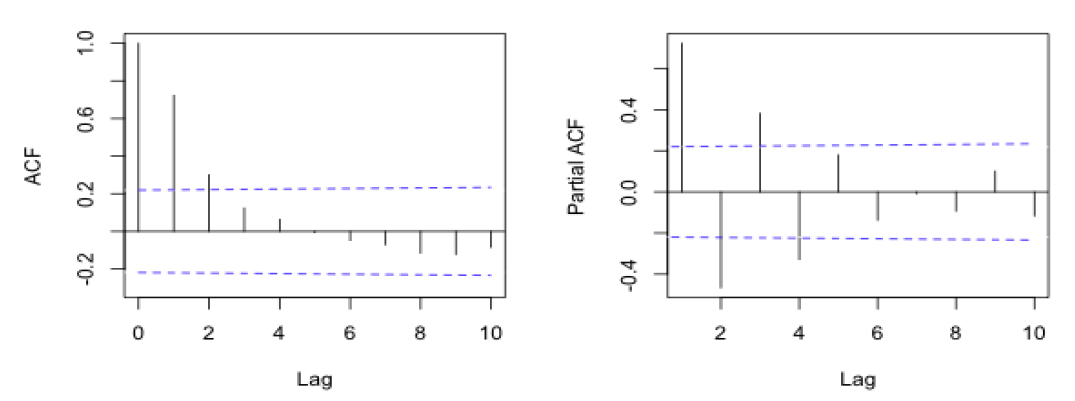
The sample ACF and PACF plot of a series are given above. Appraise the patterns and judge which ARIMA model fit the series. Justify your conclusion.

I identified as the AR(4). Is that correct? Since ACF has an exponential decay and PACF has a cut off? Differencing is not needed as the ACF decreases sufficiently to 0.

$\endgroup$
2
  • $\begingroup$ Thank you for reposting! I took the liberty of tweaking the formatting a bit more. Next time, you may want to post two separate questions in a case like this, since there are two different things and can be treated independently. Also, please next time add the self-study tag. $\endgroup$ Commented Apr 30, 2020 at 8:08
  • $\begingroup$ thank you so much! :D $\endgroup$
    – Shane Lum
    Commented Apr 30, 2020 at 8:31

2 Answers 2

2
$\begingroup$

Your series is indeed ARIMA(1,0,1), or ARMA(1,1). Your calculation of the mean is also correct, since the innovations have an expectation of zero, so

$$ E(y_t) = 5+0.3\underbrace{E(y_{t-1})}_{=E(y_t)}+\underbrace{E(\epsilon_t)}_{=0}+0.9\underbrace{E(\epsilon_{t-1})}_{=0} $$

yields

$$ E(y_t) = 5+0.3E(y_t) \Longrightarrow E(y_t)=\frac{5}{1-0.3}.$$

We can also verify this by a quick simulation in R:

> nn <- 1000
> epsilon <- rnorm(nn,0,1)
> yy <- ts(rep(NA,nn))
> yy[1] <- 5
> for ( ii in 2:nn ) yy[ii] <- 5+0.3*yy[ii-1]+epsilon[ii]+0.9*epsilon[ii-1]
> mean(yy)
[1] 7.179631

For your ACF/PACF plots, I won't give you the answer straight away. But it's not an AR(4) series. In your particular situation, I would recommend that you take a look at the ACF/PACF plots of the series yy we just simulated:

acf(yy)
pacf(yy)

Notice anything? Best to also simulate an AR(4) series and take a look at its ACF/PACF plots, to see the difference.

Note that in general, it is not easy to deduce a model from the ACF/PACF plot alone. See here for more information.

$\endgroup$
1
  • $\begingroup$ Stephen very nice work on this .. I had a miscue here ... $\endgroup$
    – IrishStat
    Commented Apr 30, 2020 at 19:39
0
$\begingroup$

For part 2, we note that the ACF shows exponential decay that cuts off at lag 2.

On the other hand, the PACF shows a damped sinusoid that decays after lag 4. Since the ACF decays more exponentially than the PACF, we can conclude that the series is an MA(q) model, where q=2.

Hence, I believe the series fits an MA (2) model best.

$\endgroup$

Your Answer

By clicking “Post Your Answer”, you agree to our terms of service and acknowledge you have read our privacy policy.

Not the answer you're looking for? Browse other questions tagged or ask your own question.