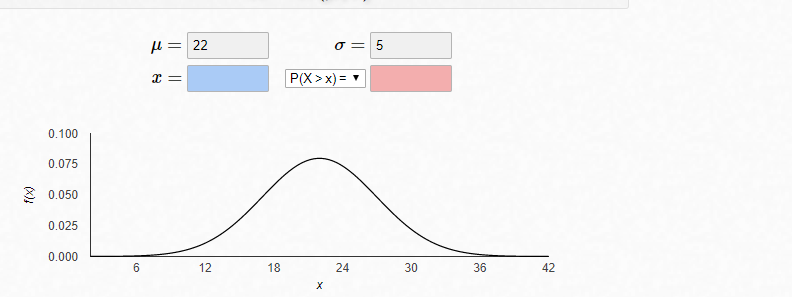
can anyone help with this question
Q: According to a survey of 10000 students, the average distance to the university is 22 minutes with a standard deviation of 5 minutes (normally distributed). a) Plot (sketch) the distribution including all relevant labels. b) How likely is it that a randomly sampled student has a distance between 15 and 25 minutes? c) How large does the interval need to be, so that a randomly samples student belongs to the 95% (99%) of the most probable distances?
so far i have done sol:: i have plotted a graph that ie most likely to fall under the 95 % if we standardize the sample mean then we can directly see in which probability area in which it lies let say we have a z score 2.5 it outside of the most unlikely events under the distribution this would called significance unit


self-studytag and read the tag wiki. $\endgroup$