1
$\begingroup$

I did a regression and want to compare my models to pick the good one. However, I got kind of warnings. I really don't understand what does it mean. The warnings are here

There were 50 or more warnings (use warnings() to see the first 50)
> warnings()
Warning messages:
1: In anova.lmlist(object, ...) :
  models with response ‘"NULL"’ removed because response differs from model 1
2: In anova.lmlist(object, ...) :
  models with response ‘"NULL"’ removed because response differs from model 1
3: In anova.lmlist(object, ...) :
  models with response ‘"NULL"’ removed because response differs from model 1 

My dataset and code are given below.

data <- data.frame(B = c("m","m","m","m","m", "m", "f","f","f","f","f"),
                   G = c("s","s","s","u","u", "u", "k","k","k","r","r"),
                   ZN =c(78,82,34,67,98,56,37,45,27,18,34),
                   GFR=c(120,100,90,60,100,110,100,90,95,87,96),
                   g1 = c(35, 2, 3, 4, 5, 6, 7, 10, 12, 41, 76), 
                   g2 = c(20, 2, 7, 2, 8, 5, 5, 3, 7, 2, 12), 
                   g3 = c(5, 0, 4, 5, 2, 4, 8, 9, 20, 1, 11),
                   g4 = c(1,3,4,5,7,3,1,5,7,3,10),
                   g5 = c(20,23, 27, 35, 12, 10, 17, 24, 21, 15, 16),
                   g6 = c(13,13,115,17,14,12,19,6,7,8,4),
                   g7 = c(5, 0, 4, 5, 2, 4, 8, 9, 20, 1, 11),
                   g8 = c(1,3,4,5,7,3,1,5,7,3,10),
                   g9 = c(20,23, 27, 35, 12, 10, 17, 24, 21, 15, 16),
                   g10 =c(13,13,115,17,14,12,19,6,7,8,4))
#Restricted model
zn17 <- lapply(data[,-c(1,2,3,4)], function(x) lm(GFR ~ x + ZN, data = data))

#Full model
zn18  <- lapply(data[,-c(1,2,3,4)], function(x) lm(GFR ~ x + ZN + B, data = data))

#Model comparison
anTR <- lapply(zn17,function(x) anova(x, zn18,test="LRT"))

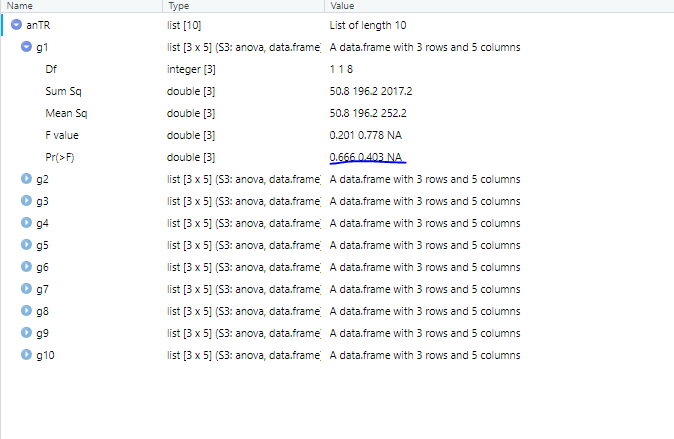
I also would like to ask what is the underline values represent in the figure below.

enter image description here

$\endgroup$

1 Answer 1

1
$\begingroup$

Splitting up the long data entry command should get part of the way there, in case that command causes anyone errors as it did for me:

data1 = data.frame(B = c("m","m","m","m","m", "m", "f","f","f","f","f"), G = c("s","s","s","u","u", "u", "k","k","k","r","r"), ZN =c(78,82,34,67,98,56,37,45,27,18,34), GFR=c(120,100,90,60,100,110,100,90,95,87,96), g1 = c(35, 2, 3, 4, 5, 6, 7, 10, 12, 41, 76), g2 = c(20, 2, 7, 2, 8, 5, 5, 3, 7, 2, 12), g3 = c(5, 0, 4, 5, 2, 4, 8, 9, 20, 1, 11), g4 = c(1,3,4,5,7,3,1,5,7,3,10), g5 = c(20,23, 27, 35, 12, 10, 17, 24, 21, 15, 16), g6 = c(13,13,115,17,14,12,19,6,7,8,4))

data2 = data.frame (g7 = c(5, 0, 4, 5, 2, 4, 8, 9, 20, 1, 11), g8 = c(1,3,4,5,7,3,1,5,7,3,10), g9 = c(20,23, 27, 35, 12, 10, 17, 24, 21, 15, 16), g10 =c(13,13,115,17,14,12,19,6,7,8,4))

data=cbind(data1,data2)
str(data)

But I continue to get errors with your last command: " In anova.lmlist(object, ...) : models with response ‘"NULL"’ removed because response differs from model 1"

The problem seems to be that R is treating your two models as non-nested models, as explained here. Perhaps this is no help, but if you break things up into smaller chunks, the anova works:

a=lm(GFR ~ g1 + ZN, data=data)
b=lm(GFR ~ g1 + ZN + B, data=data)
anova(a,b,test="LRT")

Analysis of Variance Table

Model 1: GFR ~ g1 + ZN
Model 2: GFR ~ g1 + ZN + B
  Res.Df    RSS Df Sum of Sq Pr(>Chi)
1      8 2017.2                      
2      7 2016.4  1   0.85327   0.9566
$\endgroup$
1
  • $\begingroup$ Hi Rolando2, thank you for your answer. I know in this way it works. This is just a simulation data that I created to test. My actual data is bigger than this and I can´t break my data as you did above. Thanks! $\endgroup$
    – data
    Commented Jun 1, 2020 at 12:48

Not the answer you're looking for? Browse other questions tagged or ask your own question.