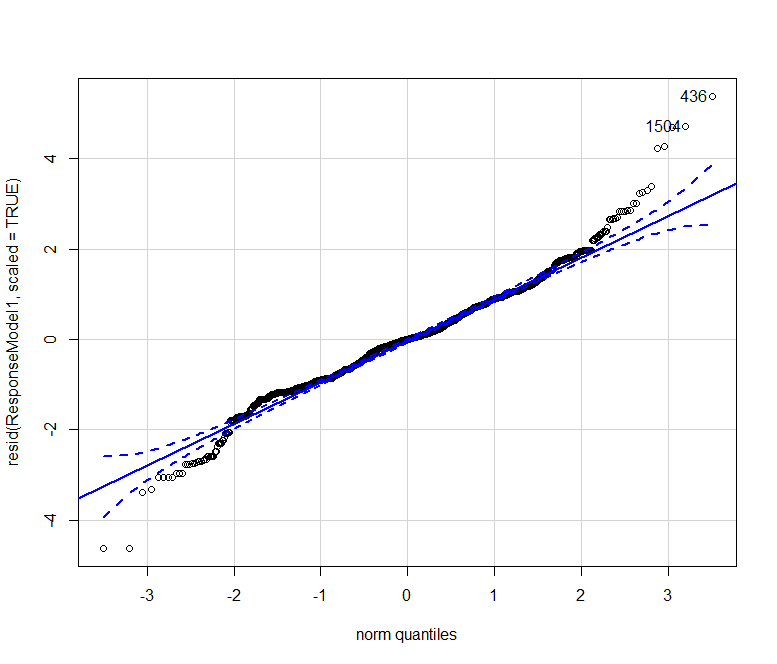
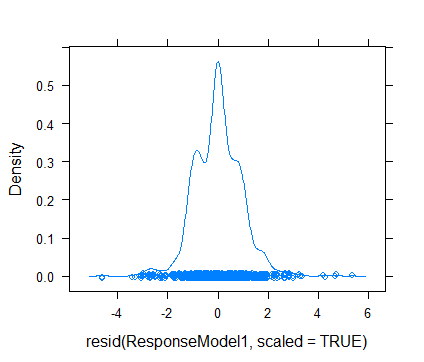
My QQ-plot indicates normality (a fairly straight line), but my density plot shows departures from normality. Why is this happening? Is this a big problem for my model?
Here's my model syntax:
response ~  block*f_transition* f_manner + (1 + block || id ),
            data = aggrdata, control = lmerControl(optimizer = "Nelder_Mead",
            optCtrl=list(maxfun=200000)))
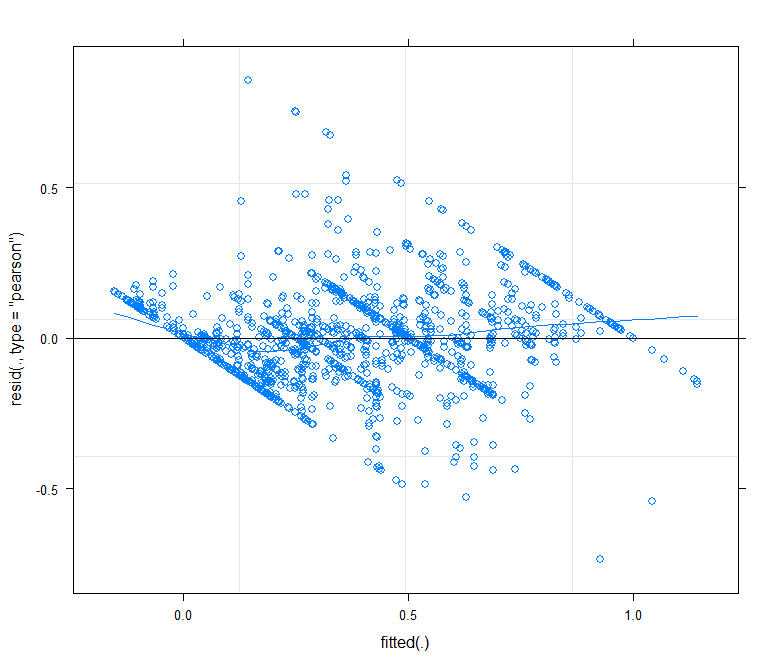
Here is also the residuals vs fitted plot


