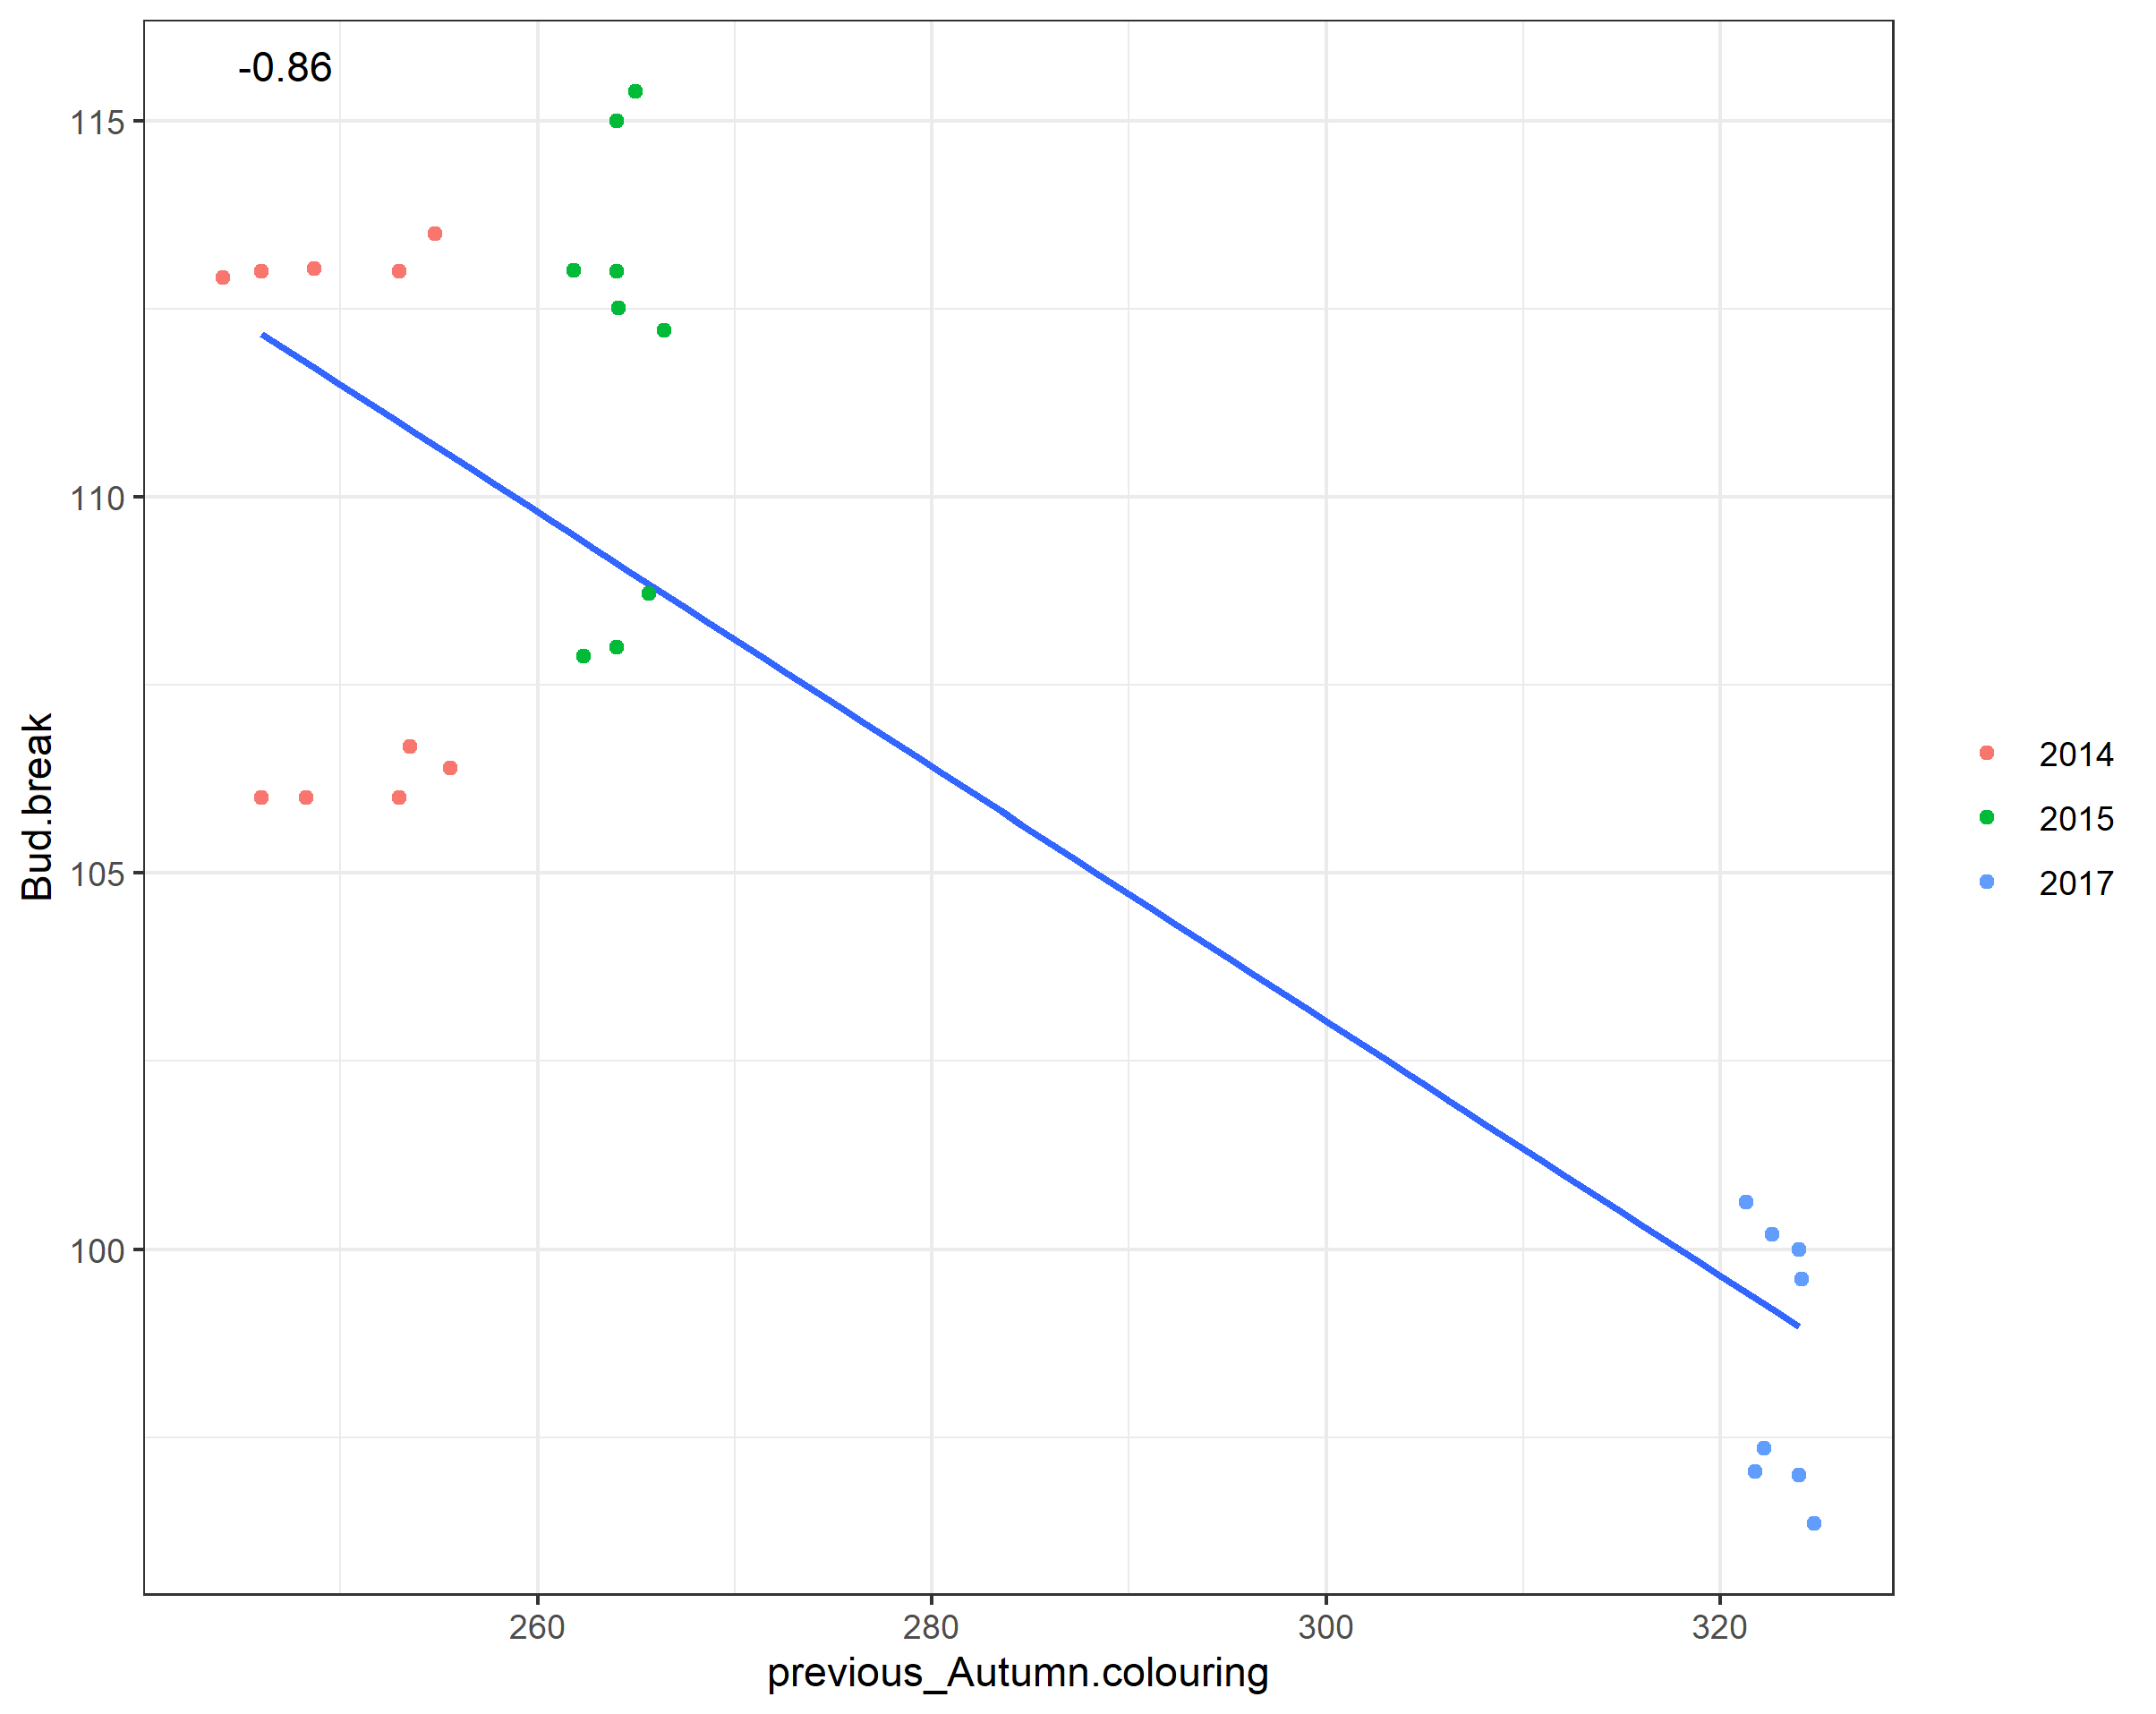
I was observing 6 trees for 3 years and recorded leaf phenological phases. I am particularly interested in how the date of autumn leaf colouring effects the bud burst date in the following year (see the plot below). Please note, the variables represent day in a year and points are jittered to make them visible. The correlation between both numeric variables is -0.86, but what is actually the proper methodological approach to model the effect of (previous) autumn colouring on bud burst date and make conclusions about statistical significance?
1 Answer
I don't see that correlation has any significance here, because this effect is clearly caused because of the year.
I think that what you need is an ANOVA method using the trees as a random effect, because I assume that there are more trees (and you are always using the same trees). You have to check differences between them and within them.
So, my suggestion would be a mixed-effect model (an example here: https://ourcodingclub.github.io/tutorials/mixed-models/).
You should use Trees as a random effect block. Year could be a random effect too, but you could use it as a simple explanatory variable. With that, you can check if autumn colouring is affecting into bud burst (or if the effect that you see is caused because of the year and/or the trees).
-
$\begingroup$ Thank you @Dave. I will test the mixed-effect model and post the result table here. If there are other opinions or suggestions about the methodological approach, it would be great. $\endgroup$ Commented Jun 10, 2020 at 17:38

