4
$\begingroup$

I am trying to analyze a dataset using number of flowers as response variable and the interaction between two treatment variables (categorical with 2 and 3 levels) as covariates. I also have a random effect, which represents different areas where the data were collected. I run a mixed-effect model with a Poisson distribution:

fit1 <- glmer(FlowerNumber ~ Treatment1 * Treatment2 + (1 | area), 
          family = poisson, data = df_flowers)

I used the DHARMa package to test for dispersion and zero-inflation. Because the model diagnostics showed underdispersion and a zero-inflation, I used the glmmTMB package with a Zero-inflated generalized Poisson

fit2 <- glmmTMB(FlowerNumber ~ Treatment1 * Treatment2 + (1 | area), 
               ziformula=~1, family = genpois, data = df_flowers)

In this way, I solved the underdispersion problem:

DHARMa nonparametric dispersion test via sd of residuals fitted vs.
simulated

data:  simulationOutput
ratioObsSim = 0.93318, p-value = 0.736
alternative hypothesis: two.sided

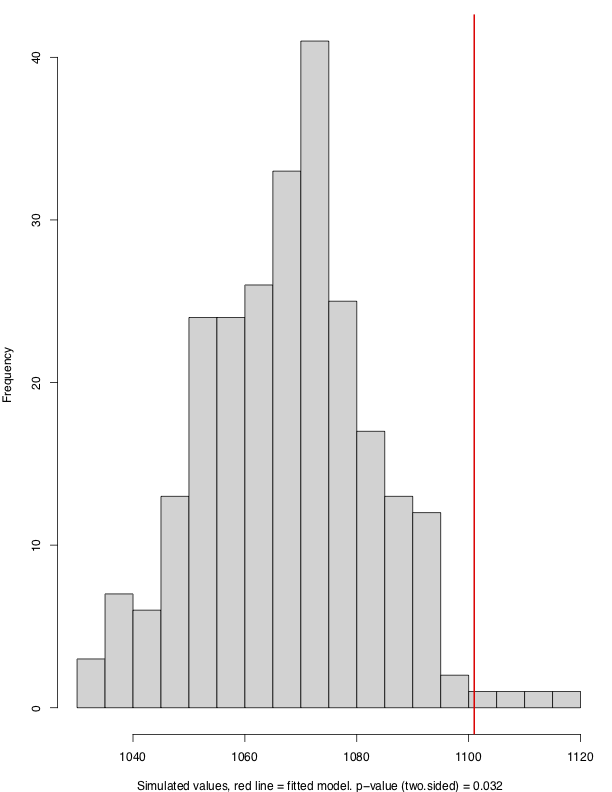
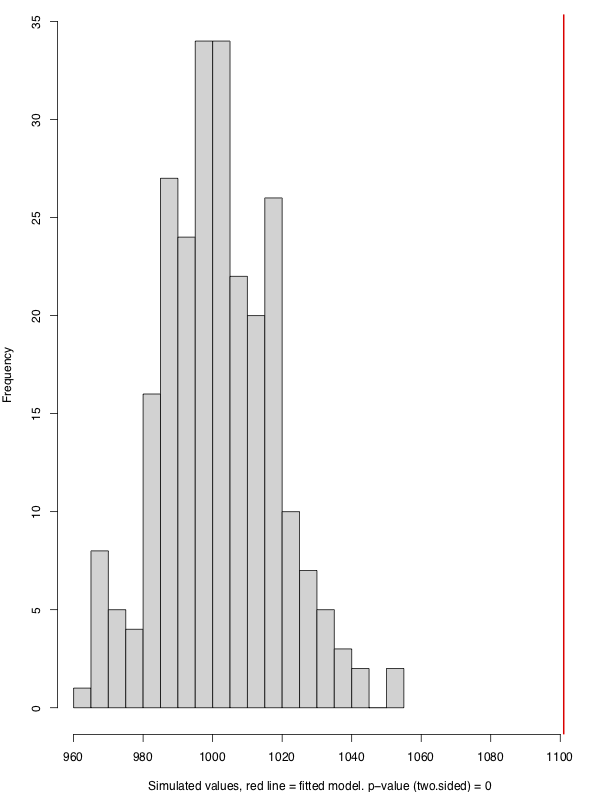
But not zero-inflation (although it's better, see first figure -Poisson- vs second figure -generalized zi Poisson):

DHARMa zero-inflation test via comparison to expected zeros with
simulation under H0 = fitted model

data:  simulationOutput
ratioObsSim = 1.0308, p-value = 0.032
alternative hypothesis: two.sided

expected distribution of zeros against the observed_pois

expected distribution of zeros against the observed_genpois

I am not sure what to do next. I found another post asking a very similar question, but the user didn't have problems with underdispersion so one of the suggestions was to run the same model with the GLMMadaptive package. I saw that GLMMadaptive doesn't include generalized Poisson, which I think I should use. Does anybody have any advice on how to proceed next?

$\endgroup$
1
  • 1
    $\begingroup$ Maybe just ~1 isn't sufficient as formula specification. What if you try ziformula=~.? $\endgroup$
    – Daniel
    Commented Jul 8, 2020 at 21:19

1 Answer 1

3
$\begingroup$

I'm the developer of DHARMa. This is a fairly specific question and it's hard to say definite things from the distance, but I would like to supply a few thoughts:

  • Underdispersion is fairly uncommon for count data, but I suppose that in this case, there might be a mechanistic explanation, which is that your plant tend to have a certain number of flowers, with a dispersion smaller than what a Poisson assumes. Does that make sense? I'm just asking to evaluate if we fit the right kind of distribution to this data.
  • The zero-inflation, although significant, doesn't seem too large in magnitude to me, so maybe you could also just ignore it. However, as suggested by Carol, making it dependent on the predictors or possibly area should take out the remaining zero-inflation
  • Thinking about the data-generating mechanism, I wonder if you have only zero-inflation, or rather a skewed distribution, where you have some plants with zero or very few flowers, for some reason. Thus, you might also have 1-inflation etc. (you can test for this with the testGenetic() function). If this is the case, however, you should usually see this in the qq-plots as well.
$\endgroup$
1
  • 1
    $\begingroup$ Thank you for your answer! It makes sense, I actually have one level of Treatment1 that barely produced flowers. If I remove it I don't have problems with zero-inflation. I tried to use ziformula=~. but the model didn't converge so I'm considering ignoring the zero-inflation as you suggested. $\endgroup$
    – CB48
    Commented Sep 3, 2020 at 0:06

Your Answer

By clicking “Post Your Answer”, you agree to our terms of service and acknowledge you have read our privacy policy.

Not the answer you're looking for? Browse other questions tagged or ask your own question.