1
$\begingroup$

How should you treat "days" as a variable from a statistical perspective. The "days" variable can be defined as an integer describing the day of the year as follows: days = 1,2,3,4...365.

  • Using a dummy variable approach would create a lot of extra variables, and i'm not sure that is a wise decision.
  • Using a integer approach, simply stating that days = [0,365], is also not necessarily correct since the dependent variable might increase during H1 and decrease during H2, such that the variable impact cancels out?

Any take on how to deal with such a varialbe?

$\endgroup$
5
  • $\begingroup$ Depends on the subject matter. For say anything astronomical or climatic or influenced thereby, it is possible that sines and cosines in time of year will do a good job. For anything economic or social, you may need something much more complicated as holidays or other special days can be (very) different, as can day of the week. Also, remember leap years. $\endgroup$
    – Nick Cox
    Commented Jul 9, 2020 at 11:04
  • $\begingroup$ check here for how to encode time in a better way. stats.stackexchange.com/questions/224990/… $\endgroup$
    – Haitao Du
    Commented Jul 9, 2020 at 12:18
  • $\begingroup$ I agree with Nick Cox. The solutions offered by spdrnl and Haitao Du presume equally spaced, continuously distributed intervals. By definition, these approaches will not capture any discrete or qualitative effects that a set of independent temporal dummy variables would express. That said, either approach can be motivated. If in doubt, try both methods and make an empirical decision based on the best results. $\endgroup$
    – user234562
    Commented Jul 9, 2020 at 19:03
  • $\begingroup$ Hmm I see, so applying cos/sin might not always work. For economic or social sciences, what would you recommend, in that case. You mention "something much more complicated", does that include PCA or any other transformation? $\endgroup$
    – RLA
    Commented Jul 10, 2020 at 9:30
  • $\begingroup$ No, PCA or any other transformation can't usually help much with the idiosyncratic effects of day of week or special days of the year. You are asking a general question, which is fine, as is an answer that what works depends on the data. Just think how you would model say road traffic or sales of anything in your country given time of year, time of week and whether it is any special day or holiday. $\endgroup$
    – Nick Cox
    Commented Jul 11, 2020 at 8:27

1 Answer 1

1
$\begingroup$

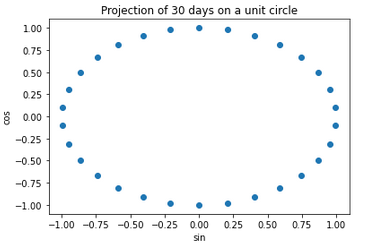
A reasonable way to feature engineer time is to project the units on a circle, where the units can be day of the week, month of the year or day of the year. Just spread out the days along the unit circle and then apply the sinus and cosine to the resulting values.

Projecting the units on a circle preserves the circularity of the values. This might be what Nick Cox suggested, but then a little more explicit.

Please find an example below of creating features for days in a month. In this case there are 30 days in the month. By projecting all the days on a unit circle clockwise, for each day one can calculate a sin and cos. If the circle is centered around zero, these values turn out to be the x and y values of the points of the circle. The x and y values can now be used as features. The same goes for days in a year, the picture just turns out less nice.

import numpy as np
import matplotlib.pyplot as plt
days = np.arange(30)
x = days * 2*np.pi/30
plt.title('Projection of 30 days on a unit circle')
plt.xlabel('sin')
plt.ylabel('cos')
plt.scatter(np.sin(x), np.cos(x))

Projection on a circle

$\endgroup$
7
  • $\begingroup$ In the plot above, have you plotted the days of a month and the dependent variable? Or what is on the x,y axises here? Thank you! $\endgroup$
    – RLA
    Commented Jul 9, 2020 at 11:51
  • $\begingroup$ +1. A better treat meant can be use Fourier expansion. See here stats.stackexchange.com/questions/224990/… $\endgroup$
    – Haitao Du
    Commented Jul 9, 2020 at 12:17
  • $\begingroup$ RLA, you are absolutely right, my graph lacked any labels and titles. It even contained a glitch. I have updated the graph and enhanced the description. $\endgroup$
    – spdrnl
    Commented Jul 9, 2020 at 12:34
  • $\begingroup$ Nice post. For me it's missing one thing (please excuse my ignorance)...the nitty-gritty transformation used to convert days of the month (e.g. 1, 2, 3...) into sine and cosine values. $\endgroup$
    – user234562
    Commented Jul 9, 2020 at 13:03
  • $\begingroup$ Yes, you are right, I will add that. $\endgroup$
    – spdrnl
    Commented Jul 9, 2020 at 14:08

Your Answer

By clicking “Post Your Answer”, you agree to our terms of service and acknowledge you have read our privacy policy.

Not the answer you're looking for? Browse other questions tagged or ask your own question.