3
$\begingroup$

I have a historical information for delivered packages (send time and receive time). Also I have an information for packages in transit (send time only). For example, all of the packages in transit were sent during the last week. I need to predict the daily count of the received packages for the next days (week or month - doesn't matter). For example, 20 packages - tomorrow, 10 packages - day after tomorrow, etc.

A trivial solution is to calculate a mean delivery time for the historical data. And then add the mean duration to the send time of packages in transit. The problem is as follows. For example, some of the packages were sent 7 days ago, and the mean delivery time is 5 days. So according to the model these packages should be delivered 2 days ago. However I know they was not delivered yet. So I can set a predicted delivery time for such a packages for a tomorrow date.

Is this an adequate model? Maybe instead of a mean delivery time calculation, I should fit a PDF and then use it for prediction?

Maybe I should make an alternative model for the delayed packages? Not just set the delivery time for a tomorrow date. For example, I can calculate a maximum delivery delay for packages in transit, and then add it to send time of these packages. It seems to be better than the "tomorrow date prediction".

I don't need to predict a receive time of each package. I need to predict just a daily package count.

Could you suggest a model for such a problem? Maybe there is an existing model, if it's a well-known problem.

UPDATE:

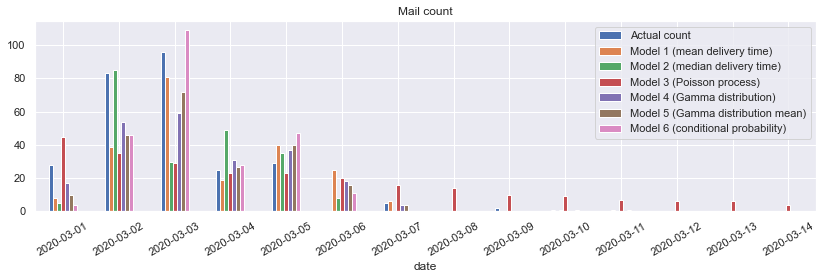
Here is a test data and several models. Summary statistics:

Model name                        | RMSE      | Actual count | Predicted count
----------------------------------|-----------|--------------|-----------------
Model 1 (mean delivery time)      | 15.468863 | 269          | 219
Model 2 (median delivery time)    | 19.989283 | 269          | 213
Model 3 (Poisson process)         | 24.059450 | 269          | 247
Model 4 (Gamma distribution)      | 14.043300 | 269          | 220
Model 5 (Gamma distribution mean) | 13.776274 | 269          | 216
Model 6 (conditional probability) | 13.619838 | 269          | 246

enter image description here

Model 1 is a trivial model from my question. Just calculate a mean delivery time and add it to send time of each mail in transit.

Model 2 is similar to Model 1. Just calculate a median instead of mean.

Model 3 is based on the answer given by @LmnICE. As I see now a mail passes several route points during delivery. I guess that delivery between neighbor points can be modelled as Poisson process. And so the distribution of delivery time is Exponential. But a total delivery time across whole delivery route should be modeled by Gamma distribution (a sum of several Exponential distributions)?

Mail delivery time distribution

  • delta14 is a delivery time in days between points 1 and 4.
  • delta24 is a delivery time in days between points 2 and 4.
  • delta34 is a delivery time in days between points 3 and 4.

Model 4 is based on Gamma distribution. It gives a better results than Model 3. However the interesting point is that the lower a scale parameter of the distribution the greater the quality of the model. For example the scale of 1 sec or 1 hour is much better than 1 day.

Model 5 - just calculate a mean value of Gamma distribution with scale equals 1 hour. And add the result to mail send time. It is much easier to calculate than to sum Gamma distributions. And also it seems that it gives better results than Models 1 and 4.

Model 6 is based on the answer given by @eithompson. Seems that it gives best results.

$\endgroup$
3
  • 1
    $\begingroup$ that's cool, seems like @eithompson's model really is better. Just a heads up about your comparison though: when you compare several models against each other to see which one does better, you should adjust your criteria based on how many models you tested, otherwise you`ll run the risk of overfitting. Essentially, model 6 might be better for this specific dataset, but it might not generalize well. $\endgroup$
    – LmnICE
    Commented Jul 19, 2020 at 17:58
  • 1
    $\begingroup$ Also, it seems as though model 1 (which is quite easy to calculate) tracks well with the actual count. Models 4, 5 and 6 track better, of course, but are a bit more complicated to calculate. $\endgroup$
    – LmnICE
    Commented Jul 19, 2020 at 18:10
  • 1
    $\begingroup$ Model 6 is more complicated than Model 1, however it seems to work better with delayed mails (the predicted total mail count is closer to the actual value). So I'll have to improve Model 1 somehow to treat delayed mails better. I agree that a cross-validation on different datasets is required. $\endgroup$
    – Denis
    Commented Jul 19, 2020 at 19:06

2 Answers 2

4
$\begingroup$

After struggling in the comments to wrap my head around how to model this thing, I realized there is a non-sexy brute force way to do it. It doesn't take advantage of the times of delivery/arrival -- it's just a simple weighted average coming from the daily counts.

  1. Construct a table from historical data in which every row is one "day-in-shipment", and we have two columns: one for days_since_shipment and one for days_until_delivery.

If a package was out for 5 days, this table should have 5 rows for that package. One with days_since_shipment = 0 and days_until_delivery = 5, then 1 & 4, etc.

  1. Calculate "conditional probabilities" of days_until_delivery given days_since_shipment.

For each unique value of days_since_shipment, we want to know what % had days_until_delivery == 0, and what % had days_until_delivery == 1, etc.

  1. Calculate weighted average using current data

Let's say #2 gives us the following for packages that have been our for shipment for 2 days:

Probability of delivery in 1 more day (i.e., day 3): 45%

Probability of delivery in 2 more days (i.e., day 4): 30%

Probability of delivery in 3 more days (i.e., day 5): 25%

Then, each package that has been out for 2 days contributes 0.45 to tomorrow's estimate, 0.30 to the next day's estimate, and 0.25 to the next next day's estimate.

Repeat the process for all other values of days_since_shipment.

edit: If you have any predictor variables, then you may want to look into a regression solution. Are these packages all being shipped from and to the same places? Or is there some kind of variation in this (sometimes shipped across 5 miles, sometimes shipped across 500 miles)? If that is true, then I think modeling this only as a function of "time since shipment" (whether through my approach or LmnICE's) is pretty limited. Ideally, you would take the "time since shipment" into account along with any other potentially useful predictors.

$\endgroup$
2
  • 1
    $\begingroup$ Thanks a lot! It seems that your model gives best results. Please see the update to my answer. However simple models based on a mean delivery time are not much worse. $\endgroup$
    – Denis
    Commented Jul 19, 2020 at 9:42
  • 1
    $\begingroup$ Great, glad it worked. Does your "mean delivery time" use the conditional logic? If not, that might be a happy medium between the two options. So, for instance, calculate that conditional mean of "time until arrival" for all packages that have been out for 2 days and use that mean. Repeat for 1 day, 3 days, etc. @Denis $\endgroup$
    – eithompson
    Commented Jul 20, 2020 at 23:29
2
$\begingroup$

Welcome to CV!

Perhaps a first approach would be to model packages delivered daily as a Poisson distribution, where the parameter would be the mean number of daily deliveries. In that case, the time between deliveries would be distributed exponentially. Here's the algorithm:

  1. Model the delivery timedelta as an Exponential distribution, where the parameter is the difference between the time when the package was received and the time when the package was sent. You should fit the parameter excluding the cases where the package is in transit;
  2. Add the delivery timedelta distribution to the sent time of each packet (now including those in transit). Now you have the probability that each package will be delivered on each specific date e.g. P(delivery of package X on date Y1), P(delivery of package X on date Y2), etc, for each package; and
  3. Simulate and aggregate to estimate daily deliveries. For each iteration in the simulation, generate a delivery date for each package, according to its distribution of delivery dates probabilities. Add together all the packages that were simulated to be delivered on the same day. That is one sample of the delivery date distribution for each day. Repeat for n iterations.

In the end, you'll have, for each day, the distribution of the number of deliveries. You can then calculate summaries such as the mean, median, qaurtiles, etc.

The benefit of that approach is that, unless you have extremely late packages, when you compare the predicted time of delivery with the date today, you should get a positive value for a fraction of most packages' distribution. In any case, when aggregating across many packages, negative values might not be that prevalent.

However, the drawback of that approach is that it assumes that the packages are delivered independently of each other. This is not exactly true if the packages are delivered in batches, e.g. as part of a delivery route.

That's what I would try first, and then I would go from there. For example, you may notice that, in my algorithm, I hand-waved a few points (negative values, violation of assumptions). You should check whether these are relevant to your use case, and if so you should tweak the algorithm to address them.

$\endgroup$
8
  • 1
    $\begingroup$ Thanks for the answer! Could you please clarify the following points? 1) On the 2nd step the delivery duration prediction is a mean of the fitted distribution? 2) If I'll have the information on package batches, then I could use exactly the same algorithm for the batches, and then just consider the size of each batch to calculate the number of packages? $\endgroup$
    – Denis
    Commented Jul 16, 2020 at 12:31
  • 1
    $\begingroup$ 1) Ideally you should probably add the entire distribution for the delivery timedelta to each package sent time, aggregate and only then extract summaries like mean, median, etc. I'll amend my answer to address that in a few minutes. $\endgroup$
    – LmnICE
    Commented Jul 16, 2020 at 12:44
  • 1
    $\begingroup$ 2) That depends: if the deliveries are organized around batches, how much does that violate the independence assumption? For monthly aggregates, probably not a lot. For daily aggregates, perhaps it somewhat affects it. This is more of a domain knowledge question, i.e. it requires knowledge in logistics. $\endgroup$
    – LmnICE
    Commented Jul 16, 2020 at 12:50
  • 1
    $\begingroup$ One key aspect of the @LmnICE approach is that it solves this problem: "So according to the model these packages should be delivered 2 days ago." Say for example the Poisson/exponential approach says that the mean arrival time is 3 days. This means that the arrival time is 3 days regardless of the amount of time elapsed so far. In your example, the packages sent 7 days ago still have 3 days to go according to Poisson. However, this isn't ideal - it's probably more like a Weibull process in which arrival rate changes as a function of IAT. I'd love to see an answer detailing how to do this. $\endgroup$
    – eithompson
    Commented Jul 16, 2020 at 16:28
  • 1
    $\begingroup$ @eithompson That's better than what I came with while writing this answer. I thought that, to deal with "negative" times, we could just say that, for each package, delivery on dates in the past is not possible (P(delivery on date in the past) = 0), and renormalize the resulting distribution so it integrates to 1. $\endgroup$
    – LmnICE
    Commented Jul 16, 2020 at 16:44

Your Answer

By clicking “Post Your Answer”, you agree to our terms of service and acknowledge you have read our privacy policy.

Not the answer you're looking for? Browse other questions tagged or ask your own question.